
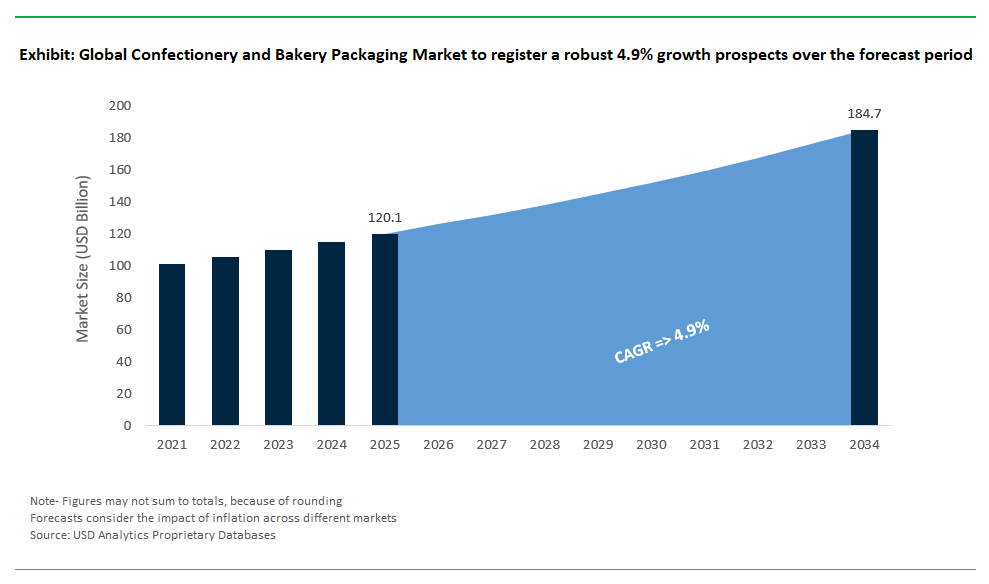
The confectionery and bakery packaging industry is poised for steady growth, with sales expected to reach $184.7 billion by 2034, registering a solid CAGR of 4.9% from $120.1 billion in 2025. This decade-long boom makes the sector a critical engine within the global food packaging market, where changing consumer demands and regulatory pressures ensure a high level of ongoing innovation. The steady market size increase reflects the growing importance of advanced packaging to maintain quality, preserve product integrity and create eye-appeal for in-store bakery and confectionery items, as the retail battle heats up.
The industry survey report identified companies investing increasingly on a broad range of packaging options from flexible films for snack bars, to rigid cartons for artisan cakes, and barrier pouches for high-quality sweets that protect, maintain, and promote a variety of sweets and baked goods. Key factors driving the growth of the market include increasing demand for convenience food, rapid proliferation of online grocery models, rising focus on food safety and the environment, and growing preference for eco-friendly packaging materials. Packaging materials and automation technologies innovations are opening up unprecedented potential in performance and environmental stewardship. Companies are rolling out more and more recyclable, compostable and bio-based materials in an effort too adhere to sustainability guidelines while continuing to seek products that offer consumers attractive and functional packaging, that adds to their brand, and sachets that won’t contribute to waste.
Recent developments across the confectionery and bakery packaging sector highlight a market in a state of flux with major investments, sustainability, and industry collaboration prevailing. In July 2025, Canadian bakery Vibrant Health Products announced plans to invest $48.5 million to open its debut US production site in Tennessee, retrofitting a former Kellogg/Kellanova Eggo plant. This expansion creates 394 new jobs and represents a continued demand for large format bakery packaging that is automation-ready and sustainable.
Mega deals and deals continue to reshape the packaging industry. Smurfit Kappa’s acquisition of WestRock in July 2024 brought together one of the world’s biggest packaging businesses, providing a significant impetus to working across confectionery and bakery formats. Commercial consortia such as the June 2024 Saica Group and Mondelēz International partnership brought paper-based multipack concepts for chocolates and biscuits to market, further driving alignment with CEPI sustainability standards. Material development marches on Constantia Flexibles’ EcoTwistPaper, a recyclable, wax-free twist wrap for confectionery and Adapa’s PaperTwister(re), which provides fast and easy-release wrap at industrial speeds, are just two examples of the sector’s duality approach: one with convenience and the other with sustainability in mind.
Significant advances in barrier technology continue: Melodea’s VBseal, which was introduced in March 2023, offers water vapor, aroma, and oil resistance, combined with heat-sealing, for use in replacing single-use plastics in the food packaging industry. Parkside’s recyclable mono-polymer films on the menu at 2023 offer high barrier protection against gas, light, oil, water and UV, with longer shelf life for sweets and decreased food waste. Recycled content is gaining traction with Mars Wrigley China introducing 100% rPET canister lids for chocolates in February 2023, reflecting global demand for circular packaging. In addition, Mondi’s acquisition of the Duino paper mill and Sonoco’s expansion via Ball MetalPack positioned both firms for further innovation in sustainable, paper-based, and rigid packaging.
Sustainability and the Circular Economy are Transforming Packaging Design
Eco-friendly is the core trend of the future for confectionery and bakery packaging. Growing wide-spread public concern about plastic pollution and the carbon impact of packaging has led brands and suppliers to focus more on sustainable options. Stringent regulations and producer responsibility frameworks like in the European Union also help to drive this change. More than 41 percent of the plastic packaging waste in the European Union was recycled in 2022, reported the European Environment Agency, and industry leaders are determined to reach higher. Billerud’s paper production in Europe is currently performed 98% fossil free and the aim is to reach 100% by 2030, so we can offer completely renewable and recyclable packaging for biscuits and confectionery. Hooks like that of Saica Group and Mondelēz show a wider commitment within the industry, as paper-based multipacks gain ground. Brands are also looking into compostable, plant-based and even mushroom- or seaweed-based packaging to reduce landfill and promote circularity.
The development of smart/interactive packaging is a critical play for brands looking to standout and appeal the the digitally-wise consumer. By incorporating QR codes, NFC tags and Augmented Reality functionality on-packaging becomes a dynamic invitation to engage with a brand, with easy access to on-the-go content, sustainability credentials and rich interactive experiences. According to our internal data, 60% of consumers feel more engaged with a company that uses personalized packaging, encouraging wider use of such technologies. Traceability, transparency, and brand storytelling are enhanced by smart packaging, addressing rising demands in the online food retail sector. Brands leveraging digital printing and design tools now offer customized chocolate gift boxes and bakery packaging featuring names or messages deepening emotional connections and boosting loyalty. As the food industry’s digital transformation continues, the adoption of interactive packaging formats will be essential for maintaining relevance and consumer trust in the confectionery and bakery sectors.
The confectionery and bakery packaging industry is defined by a mix of global packaging powerhouses and innovative regional players, each investing in sustainability, efficiency, and advanced design to capture market share.
Mondi Plc continues to be the leading integrated multinational packaging group with a focus on the entire value chain, from forestry and pulp production to production of finished packaging. The company’s January 2023 acquisition of the Duino paper mill from Burgo Group, strengthens the company’s ability to provide a full line of flexible, corrugated and specialty paper packaging for bakery and confectionery packages. Mondi is committed to offering paper where it is truly sustainable, by using virgin fibres from sustainably managed forests, recycled fibre or agri waste and quickly and easily recyclable industrial bags.
Smurfit Kappa has solidified its position as Europe’s leading corrugated packaging producer, now with expanded global presence through the acquisition of WestRock in July 2024. This move dramatically increases the company’s manufacturing footprint and solution diversity in the confectionery and bakery space. Smurfit Kappa’s portfolio ranges from shelf-ready packs and transport cartons to customized display boxes delivering sustainable, protective, and visually striking packaging tailored for fragile and perishable goods.
Amcor plc is building on its cutting-edge development of flexible packaging films, rigid containers, and specialty closures that deliver exceptional barrier performance. The company’s LifeSpan Copper Based Film enhances shelf-life and product integrity for bakery and confectionery items and is widely marketed across diverse applications. The company is further strengthening investments in material science for continued innovation in recyclability and sustainability. “Amcor’s global reach and focus on user experience keep it at the forefront of packaging transformation.”
Huhtamaki Oyj is a world leader in the food packaging market, employing sustainable solutions as well as innovations in both flexible and molded fiber packaging. The company’s recent investments in Turkey and Poland have added to its production capacity in Europe and its capacity to supply high-barrier and special barrier packaging for confectionery and baked goods. Huhtamaki's approach is focused on driving growth in sustainable, fibre-based, recyclable products that solve emerging foodservice industry needs.
DS Smith Plc is a leading provider of fibre-based recyclable packaging for bakery and confectionery markets in Europe and North America. The Company’s vertical integration from paper-making to recycling process enables to develop perfectly-closed-loop eco-friendly packaging systems. DS Smith’s own investment in sustainable design labs and innovative materials helps customers realise their circularity ambitions, with custom-made boxes and wraps that combine protection, brand opportunity and an environmental footprint minimised.
The confectionery and bakery packaging market is characterized by the widespread use of plastic for packaging, claiming a share of 48% by 2025. Flexible plastics (eg PET, PE, PP and PA) account for a further 30%, because their ultra-lightweight options offer consumers one of the most affordable and best performance barriers for moisture and aroma, which are critical for confectionery freshness. Conversely, protective containers and trays typically are formed from rigid plastics, which provide mechanical support. Bio-based and compostable technologies are proving appealing in an era when consumers are increasingly focused on sustainability and single-use plastic bans are multiplying but scaling and cost remain persistent stumbling blocks to widespread commercialisation.
Paper & paperboard packaging is witnessing escalation of take-up, and holds a 35% market share, which is attributed to growing consumer inclinations toward a sustainable, recyclable, and environment friendly material. Premium branding trends including high quality gift boxes and custom bakery packaging drive growth in the category. Corrugated board, SBS and CUK dominate this section with flexible and visually appealing packages that meet consumer trend for environmentally friendly and responsible packaging. Metal packaging and glass packaging still pursue their niche but essential remains for premium chocolates and high-end bakery, needful for more protection and elegance.
The bags & pouches segment dominated the market in 2025, with a 32% share, owing to the demand for convenient, transportable and resalable packaging among consumers. Stand-up and pillow pouches in particular are showing strong growth thanks to on-the-go snacking and confectionery. Boxes & cartons account for 28% of the market, necessary for upmarket branding and gift packaging, with folding cartons (14%) commonly used for chocolates and premium baked goods. Carton and carton clippers and roms of wraps & films, trays & inserts, and containers including jars and tins round out the market by addressing specific pack configurations for single-serve and fragile product. SumOS clamshells and blister packs target niche high-end markets where portion control is crucial or when products need to be tamper resistant.
.png)
The US is leading the way in confectionery and bakery packaging innovation, spurred on by strong investment and developments such as Vibrant Health Products $48.5m facility (Tennessee, July 2025). The growth emphasises the growing market demand for advanced packaging brought on by rising domestic manufacturing. US manufacturers are also world leaders in smart packaging techniques using digital printing and consumer-interactivity to bring brand storytelling and market interaction to life. Furthermore, stringent regulations on food safety and product packaging encourage packaging development focusing on safety and transparency that complies with the strict standards of the FDA.
The U.S. consumer habits heavily impact the packaging terrain where convenience, resealable and portability reign supreme; single-serve in the form of snacking and impulse are on the rise. High inclination towards ready-to-eat and grab-n-go convenience confectionery and bakery products also drives demand for lightweight and flexible packaging. Leading sweet’s manufacturers are keen on a packaging structures that mirrors the consumer preferences and changes in lifestyle, on the grounds of which, convenience enriched packaging is anticipated to remain the key growth driver.
Germany is a key centre for state-of-the-art packaging machinery and automation, offering sophisticated packaging solutions of high speed, productivity and reliability. Players such as Syntegon (formerly Bosch Packaging Technology) are front-runners in innovation with a strong focus on gentle handling solutions of sensitive bakery products along with high-barrier technologies for extended shelf-life. German packaging companies continue to innovate and invest in R&D in sustainable packaging materials and cutting-edge barrier technology in line with strict EU environmental laws that favour recyclability and waste minimization. And these regulations also support German ideas about the circular economy in packaging to a great extent.
German consumers prefer requires packaging to be pretty and fit for purpose, especially for premium chocolates, artisan breads or specialty bakery products. These consumer demands drive packaging manufacturers to offer solutions that combine outstanding functionality and aesthetic appeal. Support from government-supported sustainable initiatives and industry-wide cooperation in packaging innovation will drive Germany’s future leadership in the sustainable and technologically advanced confectionery and bakery packaging on a worldwide basis.
Sustainability and recyclability are increasingly encouraged by the UK in confectionery & bakery packaging, supported by a strong regulatory scenario with focus on less waste and higher recycling targets. Businesses such as DS Smith are making huge investments in cutting edge, environmentally friendly packaging while also part-funding stronger recycling infrastructure, showing true commitment to the circular economy. There is a growing public demand in the UK for transparent, environmentally-friendly packaging solutions, which is driving manufacturers to focus on sustainable packaging materials - such as those that are fiber-based and mono-material, to increase the amount that can be recycled.
Recent market activity such as Smurfit Kappa's purchase of Atlas Packaging in May 2022 show that there has been consolidation and strategic expansion in the corrugated packaging industry, which has a positive impact on bakery packaging supply chains. Sustainability by Design and Consumer-Focused Innovations Satisfying the growing consumer demand for visually appealing and high-functioning packaging, whether for premium chocolates, artisanal baked goods or snack bars. In this context, the UK is a significant market for forward-thinking and consumer and legislation-driven recyclable packaging formats.
|
Parameter |
Details |
|
Market Size (2025) |
$120.1 Billion |
|
Market Size (2034) |
$184.7 Billion |
|
Market Growth Rate |
4.9% |
|
Segments |
By Material (Plastic (Rigid Plastics, Flexible Plastics - PET, PE, PP, PA, etc.), Paper & Paperboard (Corrugated Cardboard, Solid Bleached Sulfate (SBS), Coated Unbleached Kraft (CUK), Glassine Paper, Parchment Paper), Metal (Aluminum, Tinplate), Glass, Bio-based & Compostable Materials) |
|
Study Period |
2019- 2024 and 2025-2034 |
|
Units |
Revenue (USD) |
|
Qualitative Analysis |
Porter’s Five Forces, SWOT Profile, Market Share, Scenario Forecasts, Market Ecosystem, Company Ranking, Market Dynamics, Industry Benchmarking |
|
Companies |
Mondi Plc, Smurfit Kappa Group PLC, Amcor plc, Huhtamaki Oyj, DS Smith Plc, Sonoco Products Company, Graphic Packaging Holding Company, WestRock Company (now part of Smurfit Kappa Group), Sealed Air Corporation, Crown Holdings Inc., Berry Global Inc., Ball Corporation, RPC Group (now part of Berry Global), AptarGroup Inc., Greif, Inc. |
|
Countries |
US, Canada, Mexico, Germany, France, Spain, Italy, UK, Russia, China, India, Japan, South Korea, Australia, South East Asia, Brazil, Argentina, Middle East, Africa |
* List Not Exhaustive
This comprehensive report from USDAnalytics dynamically investigates the global Confectionery and Bakery Packaging Market, highlighting industry breakthroughs, rigorous analysis reviews, and evolving market dynamics. Covering diverse packaging segments, materials, and technologies, this analysis offers essential insights critical for manufacturers, investors, and stakeholders. Detailed market evaluations across multiple geographic regions and extensive historical (2021–2024) and forecast data (2025–2034) ensure robust market understanding. The report highlights critical consumer trends, regulatory impacts, and strategic market opportunities, making it an indispensable resource for informed strategic decision-making in the confectionery and bakery packaging industry.
By Material Type: Natural, Synthetic, Natural-identical
By Product Type/Chemicals: Terpenes & Terpenoids, Benzenoids, Musk Chemicals, Aldehydes, Ketones, Esters, Alcohols, Acids, Lactones, Nitriles
By Application: Fragrances, Flavors
Geographic Scope: Analysis covers 25+ countries across North America, Europe, Asia Pacific, Latin America, and the Middle East & Africa.
Historic data: 2021 to 2024
Forecast data: 2025 to 2034
Companies Covered: Mondi Plc, Smurfit Kappa, Amcor, Huhtamaki, DS Smith, Sonoco, Graphic Packaging, WestRock, Sealed Air, Crown Holdings, Berry Global, Ball Corporation, RPC Group, AptarGroup, Greif Inc.
Table of Contents: Confectionery and Bakery Packaging Market
1. Executive Summary
2. Confectionery and Bakery Packaging Market Landscape & Outlook (2025–2034)
3. Market Analysis: Strategic Expansions and Material Innovations Transforming the Confectionery and Bakery Packaging Industry
4. Trends and Opportunities: Sustainability and Smart Packaging Driving the Future of Bakery and Confectionery Packaging
5. Competitive Landscape: Key Innovators and Market Leaders in Global Confectionery and Bakery Packaging
6. Market Share Analysis: Confectionery and Bakery Packaging Market Insights (2025)
7. Country Analysis and Outlook of Confectionery and Bakery Packaging Market
8. Confectionery and Bakery Packaging Market Size Outlook by Region (2025-2034)
9. Company Profiles: Leading Players in the Confectionery and Bakery Packaging Market
10. Methodology
11. Appendix
Market growth is propelled by rising demand for convenience foods, expanding online grocery channels, and a heightened focus on food safety and sustainability. The sector is projected to grow at a CAGR of 4.9% from 2025 to 2034, reflecting its robust expansion. Manufacturers are innovating with recyclable, compostable, and bio-based materials to meet consumer and regulatory expectations, while advanced packaging technologies help extend shelf-life and enhance product appeal.
Sustainability is reshaping packaging as brands adopt recyclable, renewable, and compostable materials to reduce environmental impact. Strict regulations and consumer awareness drive investments in mono-materials and closed-loop recycling systems. These efforts result in rapid innovation and increased adoption of eco-friendly packaging.
Smart and interactive packaging is emerging as a key differentiator, offering features like QR codes, NFC tags, and personalized designs. These technologies enable brands to provide real-time information, enhance traceability, and engage consumers digitally. Adoption of smart packaging is expected to strengthen brand loyalty and boost transparency.
Industry leaders like Mondi Plc, Smurfit Kappa, Amcor, Huhtamaki, and DS Smith are driving advances in sustainable, fiber-based, and high-barrier packaging. Strategic mergers and investments, such as Smurfit Kappa’s acquisition of WestRock, are expanding product portfolios and global reach. These companies prioritize R&D to stay ahead in sustainability, shelf-life, and design.
Plastic packaging holds the largest share due to its lightweight and cost-effectiveness, but paper and paperboard are growing rapidly on sustainability appeal. Bags and pouches are the leading packaging types, valued for convenience and portability, while boxes, wraps, and specialty containers meet branding and premium product needs. Eco-friendly materials continue to gain traction as regulations and consumer preferences evolve.