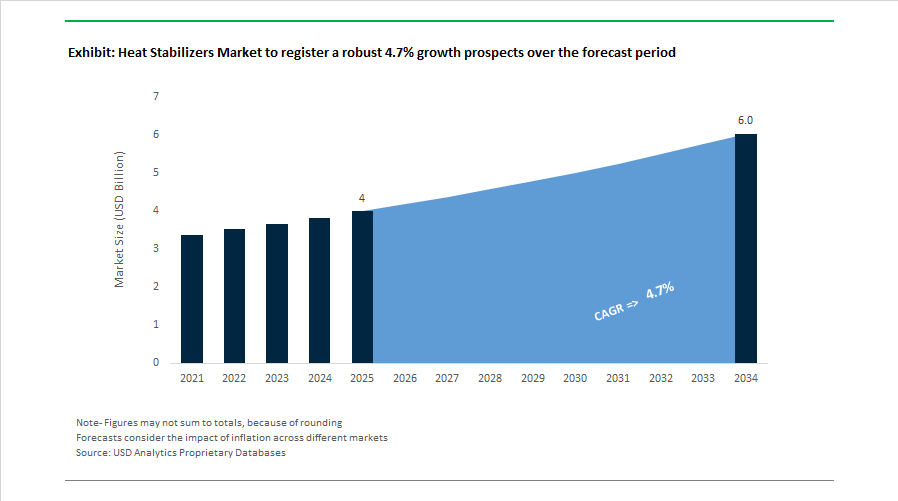
Heat Stabilizers Market to Reach $6 Billion by 2034 at 4.7% CAGR Driven by Tin Replacement, EV Infrastructure Demand, and Sustainable PVC Reformulation
The Heat Stabilizers Market is projected to grow from $4 billion in 2025 to $6 billion by 2034, registering a CAGR of 4.7%. Growth is anchored in rising demand for high-performance PVC stabilizers, calcium-zinc systems, mixed-metal stabilizers, and non-halogenated heat stabilization packages used in electric vehicle charging infrastructure, potable water piping, medical devices, wire and cable, and advanced coatings. Regulatory compliance under REACH, RoHS, and global drinking water directives is accelerating the phase-out of traditional tin and phenol-based systems in favor of eco-friendly and low-migration alternatives.
In February 2024, Galata Chemicals introduced Mark® 2921, a tin heat stabilizer engineered for large-diameter PVC pipe extrusion, targeting potable water and irrigation infrastructure requiring superior thermal resistance. During 2024, Valtris Specialty Chemicals divested its Champlor Renewables business to the Avril Group to refocus capital on mixed-metal and organic-based stabilizers for flexible PVC. In 2024–2025, Valtris and the Transfar Group expanded their phenol-free over-based barium stabilizer partnership in Asia, reinforcing supply of sustainable flame retardant stabilizers. In February 2025, Songwon Industrial Co., Ltd. showcased liquid hydroxyphenyl triazine heat stabilizers at the European Coatings Show, supporting waterborne automotive and architectural coatings. In mid-2025, BASF SE registered Ultramid® Advanced N3U42G6, incorporating a non-halogenated heat stabilization package to minimize electro-corrosion in high-voltage EV connectors.
Sustainability milestones and product innovation accelerated in late 2025. In October 2025, Baerlocher Group unveiled its Tin Replacement initiative at K 2025, introducing calcium-zinc systems aligned with evolving REACH and RoHS regulations in drinking water and medical device applications. The same month, Baerlocher confirmed installation of 92,000 m² of solar panels across production sites in Germany, Turkey, India, and Malaysia, with its Turkish facility targeting carbon neutrality by the end of 2025 and the Indian plant in 2026. Also in October 2025, ADEKA Corporation received Guinness World Records certification for TRANSPAREX™, a clarifier and heat stabilizer enabling recycled polypropylene to retain high transparency under thermal stress. In late 2025, Clean Science and Technology Limited commenced guaiacol and veratrole production, strengthening backward integration for antioxidant and heat stabilizer intermediates and reducing reliance on imports.
Strategic restructuring and EV-driven investments continued into 2026. In January 2026, Clariant AG formed a joint venture with FUHUA in Sichuan to develop non-halogenated heat and flame retardant stabilizers tailored to EV battery and high-voltage connector markets. In February 2026, Valtris appointed a new Chief Executive Officer to accelerate expansion of its Lankromark™ and Therm-Chek® lines, emphasizing sustainable PVC stabilization platforms.
The Heat Stabilizers Market outlook reflects accelerating tin replacement programs, calcium-zinc adoption, non-halogenated heat stabilization in EV charging systems, renewable-energy-aligned manufacturing decarbonization, phenol-free formulations, and vertical integration of key intermediates. Competitive differentiation increasingly depends on regulatory-compliant PVC stabilization chemistry, low-migration performance in potable water and medical applications, thermal durability for high-voltage components, and carbon-neutral production capabilities across Europe and Asia.
Heat Stabilizers Market Trends and Strategic Opportunities
Mandatory Transition to Calcium-Based and Organic Heat Stabilizers under EU REACH
The heat stabilizers market has entered a decisive regulatory phase following the full enforcement of the European Union’s ban on lead-based stabilizers in PVC. Regulation (EU) 2023/923, implemented by the European Commission in November 2024, imposes a strict maximum lead content of 0.1% by weight across all PVC products, including imports. This move has eliminated residual flexibility for legacy formulations and has forced a complete shift toward calcium-zinc and organic-based stabilizer systems across rigid and flexible PVC applications.
While many European converters had voluntarily reduced lead usage earlier, the binding nature of the regulation has global consequences. Export-oriented manufacturers supplying construction profiles, pipes, window frames, and sheets into the EU have been compelled to reformulate products to meet compliance thresholds. Technological progress has eased this transition. Hybrid calcium-zinc stabilizers combined with layered double hydroxides now deliver dynamic heat stability of up to 25 minutes at processing temperatures around 210 degrees Celsius, enabling performance parity with lead systems on high-speed extrusion lines operating above 200 kilograms per hour.
Sustainability frameworks are amplifying this trend. Green building certifications such as LEED and BREEAM increasingly favor metal-free or low-toxicity PVC formulations, accelerating adoption beyond regulatory minimums. By late 2024, calcium-based systems accounted for more than 40% of global stabilizer volume, supported by their recyclability advantages and alignment with circular economy objectives. This structural shift is repositioning calcium-zinc and organic stabilizers from alternatives to the default standard in the European PVC value chain.
Thermal Aging Resilience Becomes Critical for High-Voltage EV Platforms
The transition toward 800-volt and higher electric vehicle architectures is fundamentally changing performance requirements for heat stabilizers used in wire and cable insulation. PVC and thermoplastic elastomer compounds in EVs must now withstand continuous operating temperatures between 125 and 150 degrees Celsius while maintaining dielectric strength, flexibility, and long-term color stability. These demands exceed those of conventional internal combustion engine platforms and are reshaping stabilizer innovation priorities.
Automotive specialization has intensified accordingly. In April 2025, ADEKA expanded its global PVC stabilizer portfolio with new calcium-zinc formulations engineered specifically for automotive interiors and high-temperature wire harnesses. At the same time, specialty additive suppliers introduced advanced organotin and mixed-metal systems designed to prevent early yellowing and embrittlement under the intense thermal cycling associated with EV battery management systems.
Material innovation is extending beyond traditional metal soaps. Hydrotalcite-based additives such as Kisuma’s DHT series are increasingly integrated into PVC and specialty rubber compounds to improve thermal aging, fluid resistance, and electrical insulation. These solutions offer a high-performance alternative to fluorine-based materials that face growing regulatory scrutiny, reinforcing their strategic relevance as automakers seek durable, compliant insulation materials for next-generation EV platforms.
Advanced Stabilizer Systems for Chemically Recycled PVC Feedstock
The push toward higher recycled content under the EU Circular Economy Action Plan is creating a targeted opportunity for stabilizers tailored to recycled PVC streams. Post-consumer recycled PVC often contains residual lead and degradation byproducts that compromise thermal stability during reprocessing. To support circularity, the European Commission has granted a 7.5-year derogation allowing up to 1.5% lead in specific closed-loop recycled PVC applications. This window is driving demand for advanced stabilizer boosters capable of neutralizing impurities rather than eliminating recycled content altogether.
Hybrid calcium-zinc systems combined with layered double hydroxides are increasingly used to absorb hydrochloric acid released by aged recycled PVC, delaying discoloration and preventing chain scission during extrusion. In parallel, bio-based ligands derived from vegetable and castor oils are being developed to restore mechanical properties lost during multiple processing cycles. These renewable additives improve compatibility between recycled and virgin resin, enabling measurable reductions in melt pressure and energy consumption during pipe and profile extrusion.
Innovation pipelines reflect this opportunity. Pilot projects initiated in 2024 by BASF and ADEKA focused on bio-derived heat stabilizers for recycled PVC applications, with reported demand growth approaching 18% as converters seek lower-carbon formulations that remain compliant with evolving regulations.
Expansion of Liquid and Low-Dust One-Pack Stabilizer Systems
Operational efficiency and workplace safety are driving a parallel shift toward liquid heat stabilizers and low-dust solid one-pack systems. Liquid stabilizers accounted for more than 52% of global consumption by 2025, driven by their superior dispersion, precise dosing, and suitability for flexible PVC applications such as flooring, films, and medical tubing. These attributes are particularly valuable in automated compounding environments where consistency and transparency are critical quality parameters.
Industrial hygiene considerations are accelerating this transition. Regulatory agencies such as Occupational Safety and Health Administration and European Chemicals Agency have intensified scrutiny of airborne dust exposure in chemical handling. In response, compounders are adopting pelletized or flaked one-pack stabilizer systems that combine heat stabilizers, lubricants, and co-stabilizers into a single format. These systems reduce dust generation, minimize handling losses, and improve process reproducibility, aligning with smart manufacturing initiatives across the PVC industry.
Heat Stabilizers Market Share and Segmentation Insights
Mixed Metal Stabilizers Lead the Heat Stabilizers Market Through PVC Processing Applications
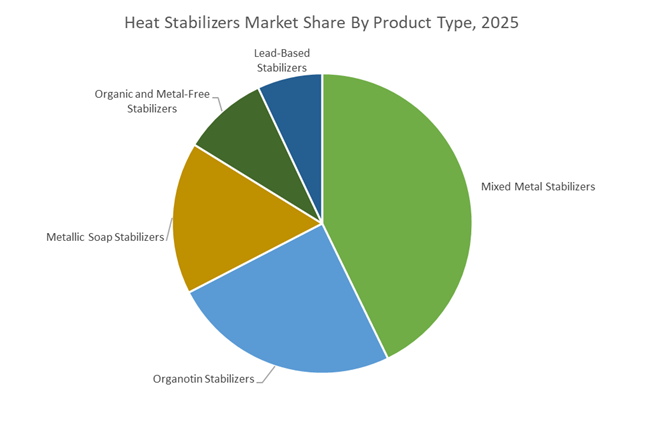
Mixed Metal Stabilizers accounted for 42.80% of the Heat Stabilizers Market share in 2025, making them the most widely adopted stabilizer system across global polymer processing industries. Mixed metal stabilizers typically include calcium-zinc and barium-zinc stabilizer systems, which provide effective thermal stabilization during polyvinyl chloride (PVC) processing. These stabilizers prevent polymer degradation by neutralizing hydrogen chloride released during heating, thereby maintaining polymer integrity, color stability, and mechanical properties during extrusion, injection molding, and calendaring processes. Mixed metal stabilizers have gained strong adoption because they offer a balanced combination of cost efficiency, processing performance, and regulatory compliance, enabling manufacturers to replace traditional heavy metal stabilizers such as lead and cadmium-based systems. In 2025, the segment is increasingly dominated by calcium-zinc stabilizer technologies, particularly in PVC applications used in construction materials. Continuous formulation improvements in calcium-zinc systems have enabled manufacturers to achieve high processing speeds, enhanced long-term thermal stability, and improved weather resistance, allowing these stabilizers to match or exceed the performance of legacy heavy metal formulations.
Building and Construction Sector Drives the Largest Demand for Heat Stabilizers
Building and Construction represented 52.80% of the Heat Stabilizers Market share in 2025, establishing it as the largest end-use sector for heat stabilizer additives. The construction industry is a major consumer of PVC-based materials used in pipes, window profiles, door frames, siding panels, flooring materials, and roofing membranes, all of which require stabilizers to prevent thermal degradation during manufacturing and to ensure long-term durability in outdoor environments. Heat stabilizers are essential for maintaining mechanical strength, color stability, and resistance to ultraviolet exposure in PVC construction products exposed to varying environmental conditions. In 2025, the construction sector is increasingly influenced by sustainable building standards and green construction certifications, including programs such as LEED and BREEAM. These certification systems encourage the use of building materials that minimize environmental and health impacts, prompting manufacturers to adopt heavy metal-free stabilizer technologies and low-VOC additive systems. As a result, demand for organic stabilizers and metal-free stabilization systems is growing in premium construction products designed for environmentally certified building projects and sustainability-focused infrastructure development.
Competitive Landscape in Heat Stabilizers Market
Baerlocher GmbH Drives Global Transition Away from Tin and Lead Stabilizers
Baerlocher GmbH remains the global benchmark in PVC heat stabilizer systems, actively leading the industry’s transition away from organotin and legacy lead-based additives. In 2025 and 2026, the company intensified its Tin Replacement Program to ensure compliance with evolving REACH and RoHS requirements for food-contact, medical-grade, and potable water PVC applications. Its Baeropol® T-Blend pastille-form additives are engineered specifically for the plastic recycling sector, suppressing thermal degradation during repeated melt processing of post-consumer PVC waste. In October 2025, Baerlocher announced substantial CO2 reductions supported by solar and biomass investments, targeting carbon neutrality by 2045. With production facilities across Europe, the Americas, and Asia, the company maintains a local-for-local supply chain strategy that mitigates geopolitical and logistics risks.
ADEKA Corporation Expands Ca-Zn Stabilizer Capacity for Automotive and Infrastructure PVC
ADEKA Corporation is strengthening its global footprint in high-performance polymer additives, particularly calcium-zinc heat stabilizers tailored for automotive interiors, construction profiles, and infrastructure pipes. In April 2025, ADEKA announced expanded PVC stabilizer production capacity, focusing on advanced Ca-Zn formulations that meet halogen-free and heavy-metal-free regulatory standards. Its ADK STAB series remains central to its portfolio, while the ADK CYCLOAID™ range integrates bio-based polymeric plasticizers to enhance recycled polymer performance. In late 2025, ADEKA’s TRANSPAREX™ clarifier received Guinness World Records certification as the most effective clarifier for polypropylene, a technology now integrated into multi-functional stabilization packages. In 2026, ADEKA is accelerating penetration into India through ADEKA India, positioning eco-friendly stabilizers for rapid infrastructure expansion.
Songwon Industrial Strengthens One Pack Stabilizer Systems in Emerging Markets
Songwon Industrial Co., Ltd., the world’s second-largest polymer stabilizer manufacturer, is expanding its integrated One Pack Systems portfolio to capture growth in PVC compounding hubs. In October 2025, Songwon announced the construction of a new OPS production facility in Saudi Arabia, reinforcing its Middle East manufacturing footprint and improving supply proximity to high-growth construction markets. The company reported consolidated sales of 1.038 trillion KRW for fiscal 2025, reflecting stable demand in polymer stabilizers and tin intermediates. Leadership changes in its Tin Intermediates and PVC Business Unit in July 2025 are aimed at accelerating next-generation thermal stabilizer development. Songwon’s sixth consecutive EcoVadis Gold rating in December 2025 underscores its focus on sustainable specialty chemical manufacturing.
Valtris Specialty Chemicals Refocuses on Low-VOC and Phthalate-Free PVC Systems
Valtris Specialty Chemicals is repositioning itself as a North American leader in sustainable PVC heat stabilizers following major corporate restructuring in early 2026. The appointment of new executive leadership in January 2026 aligns with a strategy centered on operational excellence and portfolio optimization. In February 2026, Valtris divested its renewables business to concentrate capital on core stabilizer and plasticizer technologies. Its Symmetrole® and Therm-Chek® brands provide mixed-metal Ba-Zn and Ca-Zn stabilizers designed for both rigid and flexible PVC applications. In 2026, the company is promoting low-VOC and phthalate-free formulations targeting medical flooring, wall coverings, and indoor air quality-sensitive construction segments.
Kisuma Chemicals Capitalizes on PFAS-Free Hydrotalcite Stabilization
Kisuma Chemicals is the global leader in synthetic hydrotalcite, a magnesium-aluminum layered double hydroxide used as an inorganic heat stabilizer and acid scavenger. In September 2025, Kisuma introduced DHT-4®, a hydrotalcite-based additive that significantly enhances heat and aging resistance in rubber and engineering plastics, providing a viable alternative to fluorinated materials restricted under PFAS regulations. In 2026, Kisuma is positioning itself as a green alternative to heavy-metal stabilizers, emphasizing acid neutralization and long-term thermal stability in halogen-free cable and automotive wiring systems. Its high-purity magnesium-based stabilizers are increasingly specified for telecommunications and EV wiring harnesses. The PFAS-free regulatory wave is accelerating substitution of legacy additives in CR and ECO rubber applications.
Galata Chemicals Integrates Bio-Based Plasticizers with Advanced Stabilizer Systems
Galata Chemicals remains a specialized innovator in low-tin and bio-based stabilizer packages for infrastructure and weatherable PVC applications. The recent launch of Mark® 2921, a tin heat stabilizer engineered for large-diameter PVC pipe systems, addresses the performance requirements of municipal water and wastewater infrastructure. In 2026, Galata is combining its Drapex® Alpha bio-based primary plasticizers with halogen-free stabilizers to deliver integrated green PVC additive packages. The company is expanding its technical center in India to provide localized formulation expertise for South Asia’s expanding construction and piping sectors. Galata maintains a strong presence in mixed-metal and liquid phosphite stabilizers designed for high-clarity, UV-resistant outdoor PVC profiles and siding applications.
Germany: Regulatory-Driven Transition and Circular PVC Enablement
Germany remains the policy and technology bellwether for the European heat stabilizers industry, with regulatory enforcement directly shaping formulation strategies and capital allocation. At the K 2025 trade fair, Baerlocher Group formally launched its global Tin Replacement Initiative, accelerating the conversion of rigid PVC processing lines from organotin stabilizers toward calcium-zinc systems. This move reflects tightening EU occupational health and toxicology thresholds and growing scrutiny of tin-based compounds under REACH. German processors have largely completed the post-DOTE transition following the May 1, 2025 sunset date, and are now preparing for the 2026 REACH revision, which proposes further restrictions on 21 stabilizer substances identified within the ECHA assessment pool.
Beyond compliance, sustainability and process efficiency are increasingly central to German heat stabilizer manufacturing. In October 2025, Baerlocher confirmed measurable CO₂ emission reductions across its German facilities following large-scale renewable energy integration, aligning additive production with the EU Green Deal’s low-carbon manufacturing objectives. Simultaneously, production sites across the Rhine-Ruhr chemical corridor are deploying Mechanical Vapor Recompression distillation in liquid stabilizer lines, targeting a 12% reduction in steam consumption for the 2026 fiscal year. Product innovation is also advancing at the interface of circular plastics. German research institutes, working with Akdeniz Chemson, have optimized re-stabilization packages that preserve thermal stability of recycled PVC across up to seven additional processing cycles, directly supporting EU recycled content mandates. Late 2025 has also seen commercialization of PFAS-free processing aids designed to function synergistically with liquid heat stabilizers in flexible PVC, addressing both regulatory risk and performance consistency.
India: Standards Enforcement and Localization of Calcium-Zinc Supply
India’s heat stabilizers market is undergoing a structural shift driven by stricter quality controls, domestic capacity expansion, and policy-backed substitution of toxic legacy chemistries. In July 2025, the Department of Chemicals and Petrochemicals issued the PVC Homopolymer Quality Control Amendment Order, extending mandatory compliance to all PVC additives, including heat stabilizers, by early 2026. This regulation materially raises the entry threshold for imported stabilizers and accelerates demand for BIS-compliant calcium-zinc and organic stabilizer systems across pipes, cables, and medical-grade PVC.
Industrial demand is being reinforced by parallel policy initiatives. Under the national BioE3 framework, R&D grants are being directed toward bio-based epoxidized soybean oil and plant-derived stabilizers to reduce reliance on imported petroleum-based metallic soaps. Infrastructure programs are amplifying this shift. Expansion of medical waste treatment capacity in hubs such as Kochi, funded through the 2025–26 Outcome Budget, is driving consumption of non-toxic, high-purity stabilizers for medical tubing and blood-contact PVC applications. On the supply side, domestic manufacturers including Goldstab Organics and Waldies Co. Ltd commissioned new calcium-zinc stabilizer lines in late 2025, supporting the national Har Ghar Nal Se Jal program and accelerating the phase-out of lead-based systems. Additional demand pressure emerges from BIS 11652:2017 enforcement effective January 2026, requiring heat-stable masterbatches for HDPE and PP woven sacks operating under high-speed extrusion conditions.
Japan: High-Temperature Performance and Electronics-Grade Purity
Japan’s heat stabilizers industry is distinguished by its focus on high-temperature resilience, precision purity, and advanced mobility and electronics applications. ADEKA Corporation is executing its ADX 2026 management plan with a strategic emphasis on environment-friendly polymer additives, targeting a portfolio where 95% of plasticizers and stabilizers are biomass-based. Products such as ADK CYCLOAID PNB-205 are gaining adoption for their oil resistance and thermal stability in demanding automotive and industrial environments.
Automotive electrification remains a central growth engine. ADEKA retains the leading global position in automotive electric cable stabilizers as of late 2025, with its ADK STAB RUP series widely specified for high-heat EV battery harnesses where thermal endurance and insulation reliability are critical. In parallel, Japanese suppliers are pioneering semiconductor-grade stabilizers with ultra-low ionic content to support 2026-generation electronic encapsulation, mitigating signal interference issues associated with traditional metallic soaps. At the research frontier, Japanese teams commercialized hierarchical titanium phosphate nanospheres in late 2025, demonstrating PVC thermal stability at temperatures up to 200°C, well above the conventional 150°C performance ceiling of standard stabilizer systems. These advances reinforce Japan’s role as a technology reference market rather than a volume-driven producer.
China: Raw Material Dynamics and Smart Manufacturing Transition
China’s heat stabilizers industry is increasingly shaped by upstream resource policy and manufacturing modernization. The Ministry of Industry and Information Technology issued its non-ferrous industry growth plan for 2025–2026, targeting 5% annual expansion. This policy directly influences the availability and pricing of calcium and zinc feedstocks critical for calcium-zinc stabilizer synthesis, with downstream implications for stabilizer formulation economics across PVC pipes, profiles, and wire insulation.
Strategic partnerships are strengthening domestic supply chains. In December 2025, Valtris Specialty Chemicals expanded its collaboration with Transfar Group to localize production of sustainable mixed-metal stabilizers and TCPP flame retardants for the 2026 construction cycle. Manufacturing efficiency is also improving through policy-driven digitization. Under China’s 2026 industrial modernization mandate, stabilizer plants in Shandong are adopting AI-driven catalysis and smart workshop systems, delivering an estimated 14% reduction in energy intensity for methyl tin mercaptide production. This dual focus on cost control and process optimization is reshaping China’s competitive positioning in both traditional and next-generation stabilizer chemistries.
United States: Portfolio Realignment and Green Certification Expansion
The United States heat stabilizers market is being reoriented around supply chain reliability, regulatory alignment, and application-specific innovation. In September 2025, Valtris Specialty Chemicals initiated an enterprise-wide transformation program centered on order fulfillment excellence and accelerated innovation, positioning the company as a primary domestic supplier of phenol-free barium stabilizers. This strategy reflects rising customer preference for non-phenolic systems in flexible PVC and specialty polymer applications.
Regulatory incentives are reinforcing greener formulations. The U.S. Environmental Protection Agency expanded its Safer Choice certification framework for 2026 to explicitly include secondary stabilizers such as chelators and antioxidants that meet Green Screen benchmarks. This is prompting reformulation of complete stabilizer packages rather than single-component substitutions. Beyond PVC, application-driven demand is emerging in the energy sector. In 2025, oilfield chemical providers operating in the Permian Basin shifted toward bio-based heat stabilizers for downhole polymers used in hydraulic fracturing, responding to tighter state-level groundwater protection requirements. These dynamics collectively underscore the U.S. market’s pivot toward certified, application-specific, and domestically reliable heat stabilizer solutions.
Summary Table: Country-Level Strategic Signals in the Heat Stabilizers Industry
Heat Stabilizers Market County Level Snapshot
|
Country
|
Primary Policy or Strategy
|
Industrial Focus
|
Strategic Implication
|
|
Germany
|
REACH enforcement, Tin Replacement
|
Ca-Zn systems, recycled PVC
|
Regulatory leadership and circularity
|
|
India
|
QCO amendment, BIS standards
|
Local Ca-Zn supply, bio-based stabilizers
|
Import substitution and compliance
|
|
Japan
|
ADX 2026, electronics purity
|
EV cables, semiconductors
|
High-performance specialization
|
|
China
|
MIIT growth plan, smart manufacturing
|
Feedstock economics, efficiency
|
Cost control and modernization
|
|
United States
|
Safer Choice expansion, enterprise reform
|
Phenol-free and bio-based systems
|
Certified and application-led growth
|
Heat Stabilizers Market Report Scope
Heat Stabilizers Market
|
Parameter
|
Details
|
|
Market Size (2025)
|
$4 Billion
|
|
Market Size (2034)
|
$6 Billion
|
|
Market Growth Rate
|
4.7%
|
|
Segments
|
By Product Type (Metallic Soap Stabilizers, Mixed Metal Stabilizers, Organotin Stabilizers, Lead-Based Stabilizers, Organic and Metal-Free Stabilizers), By Form (Liquid Heat Stabilizers, Solid Heat Stabilizers, One-Pack Stabilizer Systems), By Application (Pipes and Fittings, Profiles and Tubing, Wires and Cables, Coatings and Floorings, Plastisols), By End-Use Industry (Building and Construction, Automotive and Transportation, Electrical and Electronics, Packaging, Healthcare and Pharmaceuticals)
|
|
Study Period
|
2019- 2025 and 2026-2034
|
|
Units
|
Revenue (USD)
|
|
Qualitative Analysis
|
Porter’s Five Forces, SWOT Profile, Market Share, Scenario Forecasts, Market Ecosystem, Company Ranking, Market Dynamics, Industry Benchmarking
|
|
Companies
|
Baerlocher Group, ADEKA Corporation, Songwon Industrial Co., Ltd., Valtris Specialty Chemicals, Clariant AG, Akdeniz Chemson Additives, PMC Organometallix, Reagens S.p.A., Galata Chemicals, Pau Tai Industrial Corp., Goldstab Organics Pvt. Ltd., Sun Ace Kakoh Pte. Ltd., Vikas Ecotech Ltd., Shandong Jiahua Plastic Co., Ltd., KD Chem Co., Ltd.
|
|
Countries
|
US, Canada, Mexico, Germany, France, Spain, Italy, UK, Russia, China, India, Japan, South Korea, Australia, South East Asia, Brazil, Argentina, Middle East, Africa
|
Heat Stabilizers Market Segmentation
By Product Type
- Metallic Soap Stabilizers
- Calcium Stearate
- Zinc Stearate
- Magnesium Stearate
- Mixed Metal Stabilizers
- Calcium-Zinc
- Barium-Zinc
- Organotin Stabilizers
- Methyl Tin
- Butyl Tin
- Octyl Tin
- Lead-Based Stabilizers
- Organic and Metal-Free Stabilizers
By Form
- Liquid Heat Stabilizers
- Solid Heat Stabilizers
- One-Pack Stabilizer Systems
By Application
- Pipes and Fittings
- Profiles and Tubing
- Wires and Cables
- Coatings and Floorings
- Plastisols
By End-Use Industry
- Building and Construction
- Automotive and Transportation
- Electrical and Electronics
- Packaging
- Healthcare and Pharmaceuticals
By Region
- North America (United States, Canada, Mexico)
- Europe (Germany, France, United Kingdom, Spain, Italy, Rest of Europe)
- Asia Pacific (China, India, Japan, South Korea, Australia, Rest of APAC)
- South and Central America (Brazil, Argentina, Rest of SCA)
- Middle East and Africa (Saudi Arabia, UAE, South Africa, Rest of Middle East, Rest of Africa)
Top Companies in the Heat Stabilizers Industry
- Baerlocher Group
- ADEKA Corporation
- Songwon Industrial Co., Ltd.
- Valtris Specialty Chemicals
- Clariant AG
- Akdeniz Chemson Additives
- PMC Organometallix
- Reagens S.p.A.
- Galata Chemicals
- Pau Tai Industrial Corp.
- Goldstab Organics Pvt. Ltd.
- Sun Ace Kakoh Pte. Ltd.
- Vikas Ecotech Ltd.
- Shandong Jiahua Plastic Co., Ltd.
- KD Chem Co., Ltd.
*- List not Exhaustive
