Chemicals for Nutrient Removal in Wastewater Treatment Plants (WWTPs) Market: Growth Outlook and Forecast
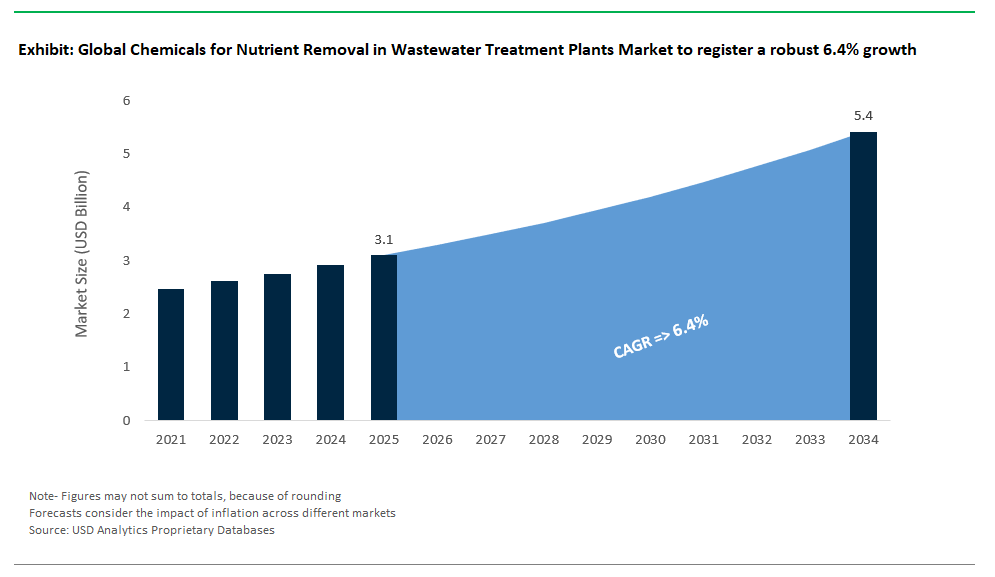
The chemicals for nutrient removal market in wastewater treatment plants is valued at $3.1 billion in 2025 and projected to reach $5.4 billion by 2034, reflecting a CAGR of 6.4%. The market has become a critical pillar in wastewater treatment plant (WWTP) operations as regulatory thresholds for total nitrogen (TN) and total phosphorus (TP) tighten across both developed and emerging economies. Phosphorus removal is still predominantly driven by chemical precipitation strategies, where ferric chloride remains the reagent of choice for achieving high removal efficiency.
At dosing ratios of 1.8–2.5 mol Fe per mol P, ferric salts consistently deliver >95% phosphorus removal, though they increase sludge yield by 15–30% a significant consideration for facilities with constrained solids handling capacity (WEF MOP 34). Alternatively, aluminum-based coagulants like alum operate effectively in the pH range of 6.0–7.0, with optimal dosing between 20–60 mg/L, routinely reducing effluent TP levels to below 0.3 mg/L, aligning with U.S. EPA benchmark criteria. On the nitrogen front, conventional denitrification remains heavily reliant on carbon supplementation, with methanol dosing requiring 3.0–3.5 mg COD per mg of nitrate-nitrogen removed. At 20°C, typical reaction rates hover between 0.9–1.4 mg N/g VSS·h, though cold-weather performance degradation remains a technical hurdle (WER, 2023).
Advanced biological solutions such as Anammox-based bioaugmentation are gaining traction in energy- and cost-sensitive WWTPs. These microbial consortia reduce aeration energy demand by up to 60% and support nitrogen removal rates between 0.8–1.2 kg N/m³/day, while bypassing the need for external carbon sources (Water Res., 2024). In hybrid systems, chemical precipitation is increasingly complemented by resource recovery technologies such as struvite crystallization. These systems, when dosed with magnesium salts under controlled pH, achieve phosphorus recovery efficiencies of 85–95% as crystalline magnesium ammonium phosphate, helping mitigate digester scaling and enabling revenue-generating fertilizer reuse (EPA).
As utilities pursue tighter discharge limits under nutrient trading and watershed TMDL frameworks, the demand for highly tunable, energy-efficient, and integration-ready nutrient control chemicals is driving a shift from bulk reagents to precision chemical programs supported by real-time analytics and lifecycle cost modeling.
Key Trends and Market Opportunities in Nutrient Removal in Wastewater Treatment Plants (WWTPs) Market
Market Trend: Shift Toward Sustainable and Smart Nutrient Recovery Solutions
The global market for nutrient removal chemicals is undergoing a major transformation driven by escalating regulatory mandates, cost pressures, and the push for circular water treatment. In 2024, innovation centered around bio-based phosphorus precipitation agents and AI-enhanced nitrogen control systems took center stage. Parallelly, the USDA-backed soybean hull extract pilot in the U.S. Midwest has demonstrated P-removal efficiency, reinforcing the market viability of upcycled agricultural waste as a chemical substitute. With the EPA’s 2024 Nutrient Criteria requiring low nitrogen and phosphorus in priority watersheds, demand is surging for precision chemical dosing that can adapt to influent variability. Meanwhile, circular economy integration particularly phosphorus recovery as struvite is becoming a commercially attractive proposition. According to Ostara, recovered struvite can be sold for $500–800 per tonne, opening revenue opportunities even as utilities reduce sludge disposal volumes and carbon emissions. Life cycle assessments show bio-coagulants lower greenhouse gas footprints by 40%, amplifying their appeal under corporate ESG goals. These developments signal a paradigm shift from pollutant removal to resource recovery, cost optimization, and low-carbon operations.
The nutrient removal chemicals market is being redefined by the rise of struvite recovery systems and smart dosing technologies, which offer utilities both economic returns and regulatory resilience. At the municipal level, Ostara’s Pearl® crystallization technology remains the gold standard successfully extracting over 5,000 tons/year of struvite at facilities like DC Water’s Blue Plains AWTP. Struvite not only offsets chemical and sludge management costs, but also qualifies for carbon credits and agricultural subsidy markets, with Yara International purchasing a large portion of Europe’s recovered phosphorus. Looking ahead, the EU’s 2027 phosphorus recovery mandate could create a $200 million+ demand for specialized crystallization aids and conditioning chemicals. In agriculture, Nutrien removes phosphorus from farm drainage, offering a low-cost path to nutrient trading credits and water quality compliance. This has been critical in phosphorus-sensitive ecosystems like Florida’s Everglades, where $500 million is allocated for advanced P-capture solutions. Industrial applications are also expanding, particularly with Paques’ ANITA™ Mox, which enhances autotrophic nitrogen removal via anammox reducing chemical oxygen demand and cutting carbon use by 60% in sectors such as food and beverage. First-mover utilities and private operators benefit from OPEX offsets, with struvite sales recovering 20–30% of WWTP operating costs (per IWA data). Meanwhile, compliance avoidance is another strong driver. Finally, sustainability-linked finance is adding momentum: Microsoft’s “water-positive” funding programs are directly supporting nutrient recovery tech as part of its global ESG framework. These forces converge to make smart, sustainable nutrient control a critical lever in the modernization of wastewater treatment infrastructure.
Competitive Landscape: Chemicals for Nutrient Removal in Wastewater Treatment
The nutrient removal segment in wastewater treatment has become both complex and important. This change is fueled by stricter phosphorus and nitrogen discharge regulations, needs for nutrient recovery, and goals for cost and performance. Leading companies are increasingly blending traditional coagulants with new biological and digital methods to meet the demands of municipal utilities and industrial facilities that handle nutrient-rich or varying effluents.
Ferric and aluminum-based coagulants continue to be essential for chemical phosphorus removal. Kemira Oyj is a global leader in this area, offering a wide range of PIX (ferric) and PAX (aluminum) coagulants, along with polymer and MBBR-based biological improvements. Its integrated strategy, backed by the Kemira Connect digital dosing platform, gives it a strong position in municipal markets where stable compliance and chemical efficiency are vital. Competitors like Ecolab/Nalco Water and Solenis are narrowing the gap by providing blended coagulants, nutrient-specific enzymes, and integrated analytics. Ecolab’s 3D TRASAR™ system shows how chemical supply can now be connected with real-time control, allowing for "chemicals-as-a-service" models.
Flocculants and carbon sources are also crucial for nutrient management, especially in facilities using enhanced biological nutrient removal (EBNR). BASF, SNF Floerger, and Solenis lead in this field, using advanced polymer chemistry to aid in both phosphorus precipitation and sludge handling. Their offerings include carbon sources for denitrification, such as glycerin, methanol, and proprietary glycerol blends like MicroC™ (Solenis) or Biofloc™ (SNF). Sustainability and supply security are increasingly influencing R&D directions, with companies investing in bio-based flocculants and sourcing carbon from renewable or waste-derived materials.
Biological enhancement is becoming a major differentiator, particularly in nitrogen removal. Kurita, IER Water, and Organica Biotech are advancing microbial and enzymatic innovations that enhance nitrification and denitrification stability, especially in low-temperature or toxic-load situations. These bioaugmentation strategies are often used to lessen the need for external carbon dosing or to stabilize performance with variable influents. Larger companies like Veolia and Xylem (through Evoqua) integrate chemical dosing with hybrid systems such as MBBR or fixed-film reactors. They are also increasingly providing biological and chemical adjustments using digital twins and sensor-based control systems.
Regionally, distributors like Hawkins, Inc. play an important role in bulk chemical logistics, especially for cost-sensitive municipalities in North America. Their strength lies not in formulation innovation but in providing a reliable supply of ferric chloride, alum, and basic carbon sources like sodium acetate or methanol. These suppliers enhance the overall market by ensuring chemical availability where advanced biological solutions might not be possible.
Overall, the market is moving toward a blended approach: using traditional chemical dosing for reliable compliance while implementing microbial enhancements and real-time monitoring to reduce consumption and environmental impact. As nutrient recovery (like struvite precipitation) and carbon optimization become more important in regulatory frameworks and client sustainability targets, the competitive edge is shifting to companies that can offer integrated and flexible nutrient removal systems across various operational settings.
Chemicals for Nutrient Removal (Nitrogen and Phosphorus) in Wastewater Treatment Plants Market – Segmentation Insights (2025–2034)
By Nutrient Removed: Phosphorus Removal Leads the Market While Nitrogen Removal Grows Faster
Phosphorus removal chemicals dominate the nutrient removal chemicals market in wastewater treatment plants, comprising approximately 58.5% of total demand in 2025. This segment's leadership is driven by increasingly stringent global discharge regulations aimed at curbing eutrophication in lakes, rivers, and coastal zones. Jurisdictions like the European Union and certain U.S. states have set phosphorus limits as low as 0.1 mg/L, prompting widespread use of high-efficiency precipitants such as ferric chloride, alum, and polyaluminum compounds. These chemicals enable rapid and reliable removal of orthophosphate and total phosphorus, even in advanced tertiary treatment stages. In contrast, nitrogen removal chemicals are gaining market share at a faster pace, expanding at a 7.8% CAGR through 2034. This growth is driven by growing mandates for nitrogen control in ecologically sensitive watersheds, where excess nitrates and ammonia contribute to hypoxia and algal blooms. Nitrogen control strategies are increasingly incorporating chemical aids to enhance biological denitrification or facilitate direct ammonia oxidation in high-load industrial and municipal effluents, particularly in regions like East Asia and North America.
By Mechanism of Action: Chemical Precipitation Leads While Carbon-Based Denitrification Grows Fastest
Chemical precipitation remains the most widely adopted mechanism for nutrient removal, accounting for around 43.7% of the market share in 2025. Alum and ferric-based salts dominate this category, offering reliable and cost-effective removal of soluble phosphorus from municipal and industrial wastewater. These reagents are often applied in both primary and tertiary treatment stages and are compatible with existing infrastructure, making them a default solution for phosphorus control. Meanwhile, the fastest-growing segment is the use of carbon sources for biological denitrification, projected to grow at a 8.1% CAGR through 2034. This growth is driven by the need to supply external carbon for heterotrophic bacteria that convert nitrates to nitrogen gas, especially in advanced biological nutrient removal (BNR) systems. Alternatives to methanol such as glycerol, acetate, and molasses are gaining popularity for their improved safety, biodegradability, and cost-effectiveness. Adsorption technologies are also seeing strong momentum, particularly with the adoption of advanced materials like lanthanum-modified clays and biochar composites that offer high selectivity for phosphate. Chemical oxidation methods using agents such as ozone or permanganate are expanding in niche applications, while pH adjustment and catalytic support continue to serve secondary roles in optimizing precipitation and biological reactions.
United States: Regulatory Innovation Drives Nutrient Removal Chemicals Market
The United States remains a global leader in the chemicals for nutrient removal market, propelled by robust federal and state mandates to address nitrogen and phosphorus pollution in water bodies. The Environmental Protection Agency (EPA) enforces strict discharge standards under the Clean Water Act, particularly targeting priority regions like Chesapeake Bay and Long Island Sound. Programs such as the Chesapeake Bay Restoration Fund enable wastewater treatment plants in Maryland to access state funding for Enhanced Nutrient Removal (ENR) upgrades, mandating effluent standards as stringent as 3 mg/L total nitrogen and 0.3 mg/L total phosphorus. Meanwhile, the Long Island Nitrogen Action Plan (LINAP) showcases a comprehensive approach combining policy, technology deployment, and community initiatives to reduce nitrogen inputs and curb eutrophication.
The U.S. market is also characterized by rapid innovation in treatment technologies. Companies are introducing hybrid systems that utilize chemical precipitation using alum or ferric chloride for phosphorus removal in tandem with advanced biological processes for nitrogen. The growing adoption of Innovative Alternative Onsite Wastewater Treatment Systems (I/A OWTS) reflects a shift toward decentralized solutions that blend chemical and biological approaches. This regulatory environment, combined with public investment and technological progress, is making the U.S. a benchmark for nutrient removal solutions globally.
China has emerged as a dominant force in the nutrient removal chemicals market, underpinned by ambitious water quality targets and massive infrastructure investment. The government’s “Water Ten Plan” and “Dual Carbon” initiatives have ushered in a new era of water governance, with over RMB 26 billion dedicated to water pollution control in 2024 alone. Revised national standards now demand stricter nutrient limits, spurring rapid upgrades of municipal wastewater systems to quasi-Class IV discharge quality. This has led to a sharp increase in demand for chemicals and technologies for both phosphorus and nitrogen removal.
Coastal hubs like Shanghai and the Greater Bay Area are at the forefront, implementing cutting-edge nutrient removal in large-scale projects. China is also pioneering tailored solutions for rural wastewater management through its new “6S principle,” supporting decentralized treatment with specialized chemical dosing. The integration of advanced chemical and biological processes is becoming standard, ensuring compliance with evolving regulations. China’s focus on sustainable urbanization and rural revitalization continues to drive investment in nutrient removal technologies, making it a global hotspot for market growth and innovation.
Germany: Pioneering Resource-Efficient and Decentralized Nutrient Removal
Germany sets the standard for sustainable, energy-efficient nutrient removal, shaped by the EU Water Framework Directive and the country’s commitment to resource recovery. German companies and utilities are known for deploying both chemical and biological nutrient removal systems at scale, with a strong emphasis on environmental performance. Innovative technologies such as WTE Wassertechnik’s patented NELIS and ANELIS biofilm procedures enable simultaneous nitrification and denitrification, reducing both reactor volume and energy consumption compared to traditional methods. These solutions address nutrient pollution while supporting operational efficiency.
Resource recovery is a defining trend in Germany’s market. Projects like KonBioN focus on the sustainable treatment of nitrate-contaminated concentrate from reverse osmosis, highlighting the potential for circular water management. Decentralized solutions, such as Fluence’s Membrane Aerated Biofilm Reactor (MABR) technology, are gaining traction for both urban and rural applications, enabling highly efficient nutrient removal within a minimal footprint. Germany’s leadership in technology, combined with stringent regulation, positions it as a reference market for nutrient removal chemicals in Europe and beyond.
India: National Missions and Industrial Growth Propel Nutrient Removal Solutions
India’s chemicals market for nutrient removal is witnessing robust growth, fueled by large-scale government initiatives like “Namami Gange” and the “Jal Jeevan Mission.” These programs have triggered massive investment in new sewage treatment plants, especially along the Ganga River basin, driving significant demand for coagulants, flocculants, and other chemicals to meet discharge standards for nitrogen and phosphorus. The Council of Scientific & Industrial Research (CSIR) and the National Environmental Engineering Research Institute (NEERI) are at the forefront of developing low-cost, effective biological nutrient removal (BNR) technologies.
A key application area is the treatment of complex industrial effluents from textiles, pharmaceuticals, and power plants. As wastewater streams become more challenging, advanced chemical and biological nutrient removal solutions are being adopted to meet stricter water quality standards. The Swachh Bharat Mission (Grameen) further drives demand in rural areas, targeting solid and liquid waste management to safeguard village water resources. India’s holistic approach integrating public policy, research, and industrial investment continues to shape the evolving nutrient removal chemicals market.
United Kingdom: Infrastructure Overhaul and Legal Reform Accelerate Nutrient Removal Market
The United Kingdom is undergoing a historic transformation in its nutrient removal chemicals market, driven by unprecedented infrastructure investment and regulatory reform. Water UK’s £104 billion investment plan (2025–2030) marks the largest upgrade in water and sewage infrastructure, with a central goal of reducing phosphorus levels to protect aquatic ecosystems. The Levelling-Up and Regeneration Act, enacted in late 2023, mandates that certain wastewater treatment facilities be modernized by 2030 to efficiently remove nutrient pollution a move directly stimulating demand for nutrient removal chemicals.
Regulators such as Natural England are enhancing nutrient budget calculators for developers, ensuring alignment with plant upgrade timelines and anticipated chemical needs. The push to modernize sewer systems and reduce storm overflow spills adds another layer of market growth, as new and retrofitted treatment processes must deliver enhanced nitrogen and phosphorus removal. Ongoing innovation, strong regulatory support, and clear targets make the UK a bellwether for nutrient removal market trends in Europe.
Brazil: New Sanitation Framework and Water Reuse Projects Boost Demand for Nutrient Removal
Brazil’s nutrient removal chemicals market is rapidly expanding due to a new legal framework for sanitation and increased private investment in infrastructure modernization. The government’s ambitious goal of universal access to potable water and sewage treatment by 2033 has catalyzed the construction and upgrading of treatment plants nationwide. Landmark projects, such as Veolia’s Vitória Water Reclamation Station, demonstrate Brazil’s commitment to advanced nutrient removal converting municipal wastewater plants into water reuse production facilities using the latest biological nitrogen and phosphorus removal technologies.
This dual focus on environmental protection and industrial water security is a hallmark of Brazil’s market. Major industries, such as steel and mining, rely on high-quality reclaimed water, underlining the importance of efficient nutrient removal. The ongoing standardization of sanitation regulations is expected to provide a stable, predictable environment for chemical suppliers and technology providers, supporting continued market growth.
Japan: High-Tech Nutrient Removal and Rural Solutions for Sustainable Water Management
Japan’s market for chemicals in nutrient removal is characterized by technological sophistication and a commitment to optimizing both urban and rural water treatment. While large cities have long used advanced nutrient removal systems, there is a growing push to extend these technologies to rural regions. The deployment of “Johkasou” purification tanks which utilize A2/O (anaerobic/anoxic/oxic) processes enables effective nitrogen and phosphorus removal in decentralized settings. Academic studies are improving these systems, with electro-coagulation research showing increased phosphorus removal efficiency.
Japan is also pioneering vegetation-based water treatment, leveraging the natural purification abilities of ecosystems for low-energy, rural applications. Continuous investment in optimizing existing infrastructure creates a consistent demand for chemicals and technologies that ensure compliance and support water recycling. Japan’s blend of innovation and focus on sustainable resource management positions it as a model for high-performance nutrient removal in diverse settings.
Australia: Ecosystem Protection and Population Growth Drive Demand for High-Efficiency Nutrient Removal
Australia’s chemicals market for nutrient removal is defined by the need to protect sensitive aquatic ecosystems while adapting to climate change and urban population growth. State-level guidelines, such as Queensland’s requirements for strict median concentrations of total nitrogen (5 mg/L) and phosphorus (1 mg/L), are pushing the adoption of advanced nutrient removal systems. Water utilities are leveraging data-driven approaches to continually improve treatment efficiency and environmental outcomes.
The largest nutrient loads in regions like South East Queensland originate from sewage treatment plants, making high-performance removal chemicals and technologies essential. Continued investment in plant upgrades, combined with policy focus on managing population-driven increases in wastewater, supports the market’s growth trajectory. Australia’s success in achieving high levels of nutrient removal sets a regional benchmark for ecosystem stewardship and water quality management.
Chemicals for Nutrient Removal (Nitrogen and Phosphorus) in Wastewater Treatment Plants Market Report Scope
Chemicals for Nutrient Removal (Nitrogen and Phosphorus) in Wastewater Treatment Plants Market
Parameter
Details
Market Size (2025)
$3.1 Billion
Market Size (2034)
$5.4 Billion
Market Growth Rate
6.4%
Segments
By Nutrient Removed (Phosphorus Removal Chemicals, Nitrogen Removal Chemicals), By Application Stage (Primary Treatment, Secondary Treatment, Tertiary/Polishing Treatment, Sludge Treatment), By Mechanism of Action (Chemical Precipitation, Chemical Oxidation, Adsorption, pH Adjustment/Catalysis, Carbon Source for Biological Denitrification), By End-User (Municipal Wastewater Treatment Plants, Industrial Wastewater Treatment Plants
Study Period
2019- 2024 and 2025-2034
Units
Revenue (USD)
Qualitative Analysis
Porter’s Five Forces, SWOT Profile, Market Share, Scenario Forecasts, Market Ecosystem, Company Ranking, Market Dynamics, Industry Benchmarking
Companies
Kemira Oyj (Finland), Ecolab Inc. (U.S.), BASF SE (Germany), Solenis LLC (U.S.), Kurita Water Industries Ltd. (Japan), Veolia Water Technologies (France), SNF Floerger (France), Hawkins, Inc. (U.S.), Xylem Inc. (U.S.), Organica Biotech Pvt. Ltd. (India), IER Water (U.S.),
Countries
US, Canada, Mexico, Germany, France, Spain, Italy, UK, Russia, China, India, Japan, South Korea, Australia, South East Asia, Brazil, Argentina, Middle East, Africa
Chemicals for Nutrient Removal (Nitrogen and Phosphorus) in Wastewater Treatment Plants Market Segmentation
By Nutrient Removed
Phosphorus Removal Chemicals
Metal Salts (Precipitants)
Proprietary Formulations
pH Adjusters
Nitrogen Removal Chemicals
Chemical Oxidation/Breakpoint Chlorination
Magnesium Salts (for Struvite Precipitation)
External Carbon Sources (for Denitrification - used in biological processes but considered an additive chemical)
pH Adjusters (for ammonia stripping or biological process optimization)
Europe (Germany, UK, France, Spain, Italy, Russia, Rest of Europe)
Asia Pacific (China, India, Japan, South Korea, Australia, South East Asia, Rest of Asia)
South America (Brazil, Argentina, Rest of South America)
Middle East and Africa (Saudi Arabia, UAE, Rest of Middle East, South Africa, Egypt, Rest of Africa)
Top Companies in Chemicals for Nutrient Removal (Nitrogen and Phosphorus) in Wastewater Treatment Plants Market
Kemira Oyj (Finland)
Ecolab Inc. (U.S.)
BASF SE (Germany)
Solenis LLC (U.S.)
Kurita Water Industries Ltd. (Japan)
Veolia Water Technologies (France)
SNF Floerger (France)
Hawkins, Inc. (U.S.)
Xylem Inc. (U.S.)
Organica Biotech Pvt. Ltd. (India)
IER Water (U.S.)
* List Not Exhaustive
Research Coverage
This report investigates the dynamics of the Chemicals for Nutrient Removal (Nitrogen and Phosphorus) in Wastewater Treatment Plants Market, offering an in-depth analysis of industry breakthroughs, technological innovations, and regulatory frameworks shaping market growth. USDAnalytics delivers comprehensive insights through meticulous data analysis, segment-wise reviews, and strategic trend mapping. This report highlights growth drivers, competitive benchmarking, and strategic developments, making it an essential resource for industry professionals seeking actionable intelligence for informed decision-making in a fast-evolving market.
By Mechanism of Action: Chemical Precipitation, Chemical Oxidation, Adsorption, pH Adjustment, Carbon Source for Biological Denitrification
By End-User: Municipal WWTPs, Industrial WWTPs (Food & Beverage, Chemical, Pharmaceutical, Textile, Pulp & Paper, Agriculture, Mining, Others)
Geographic Scope: Analysis spans 25+ countries across North America, Europe, Asia Pacific, Latin America, the Middle East & Africa.
Data Coverage: Historic data from 2021 to 2024 and forecast data from 2025 to 2034.
Companies Covered: Kemira Oyj, Ecolab Inc., BASF SE, Solenis LLC, Kurita Water Industries Ltd., Veolia Water Technologies, SNF Floerger, Hawkins Inc., Xylem Inc., Organica Biotech Pvt. Ltd., IER Water.
Methodology
USDAnalytics employs a hybrid research methodology combining primary and secondary approaches to ensure data accuracy and reliability. Primary research includes expert interviews, surveys with industry stakeholders, and validation through multiple rounds of discussion with wastewater treatment specialists. Secondary research leverages reputable databases, government publications, and peer-reviewed journals for trend analysis and market sizing. Advanced modeling techniques, top-down and bottom-up approaches, and triangulation ensure robust forecasts from 2025 to 2034, while aligning findings with real-world industry developments and technological benchmarks.
Deliverables
Complete Market Research Report (PDF, Excel): data tables, market charts, and visual insights.
Country-Level Forecasts & Analysis
Segment-wise Revenue Projections (2025–2034)
Competitive Benchmarking & SWOT Analysis
Recent Developments & News Tracker
Executive summary and key takeaway slides for boardroom presentations
Post-Purchase Analyst Support for Client-Specific Questions and Custom Data Requirements
Table of Contents: Chemicals for Nutrient Removal in Wastewater Treatment Plants (WWTPs) Market
1. Executive Summary
1.1. Market Highlights
1.2. Key Findings
1.3. Global Market Snapshot
2. Chemicals for Nutrient Removal Market Outlook (2025–2034)
2.1. Introduction to Chemicals for Nutrient Removal in WWTPs
2.2. Market Valuation and Growth Projections (2025–2034)
2.2.1. Current Market Size (2025): $3.1 Billion
2.2.2. Forecasted Market Size and CAGR (2034): $5.4 Billion at 6.4% CAGR
2.3. Key Chemical Strategies and Performance
2.3.1. Phosphorus Removal: Ferric Chloride and Alum Precipitation
2.3.2. Nitrogen Removal: Carbon Supplementation for Denitrification
2.4. Advanced Solutions: Anammox and Struvite Recovery
2.5. Market Drivers: Tighter Regulations and Resource Recovery
3. Key Trends and Market Opportunities
3.1. Trend: Shift Toward Sustainable and Smart Nutrient Recovery Solutions
3.1.1. Bio-based Phosphorus Precipitation Agents from Upcycled Waste
3.1.2. AI-Enhanced Nitrogen Control and Precision Dosing
3.1.3. Circular Economy Integration for Phosphorus Recovery
Ferric chloride and alum are the leading chemicals for phosphorus removal, offering >95% efficiency, while methanol and glycerol are commonly used as carbon sources for nitrogen denitrification. Advanced bio-based and hybrid solutions are also gaining ground as utilities seek lower carbon footprints and improved resource recovery.
Stricter discharge standards for total nitrogen and phosphorus, such as EPA and EU directives, are driving increased demand for high-efficiency nutrient removal chemicals. Regulatory support for struvite recovery and smart dosing is encouraging innovation and rapid adoption of new chemical and biological solutions.
Major trends include the adoption of struvite recovery for phosphorus, bio-based chemicals, and AI-enhanced dosing systems. Utilities are shifting from bulk chemicals to precision programs that combine real-time analytics, energy savings, and circular resource recovery models.
Struvite recovery allows wastewater plants to capture and reuse phosphorus as a valuable fertilizer, reducing chemical and sludge management costs. It supports circular economy goals, lowers greenhouse gas emissions, and creates new revenue streams from recovered resources.
The United States, China, and Germany are leading due to strong regulatory frameworks and investment in advanced treatment. Emerging economies like India and Brazil are rapidly scaling up adoption, driven by national sanitation missions and industrial expansion.

 in Wastewater Treatment Plants Market By Mechanism of Action (2025).png)