Market Overview: Recycled Materials and Industrial Strength Driving Growth
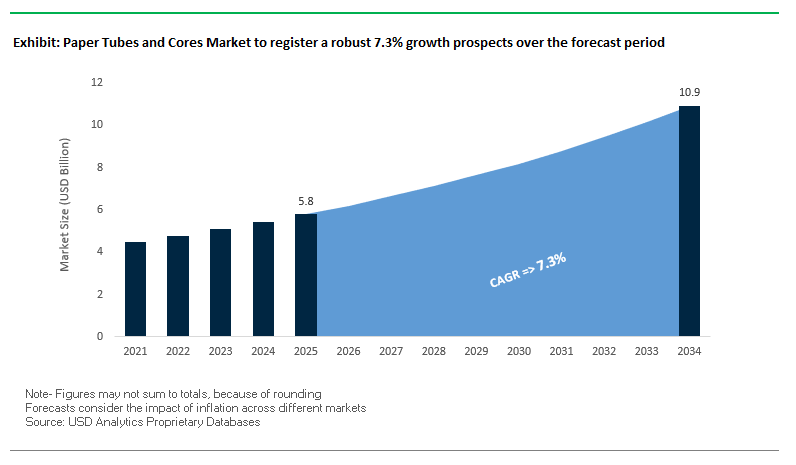
The global paper tubes and cores market is projected to reach USD 5.8 billion in 2025 and expand to USD 10.9 billion by 2034, growing at a strong CAGR of 7.3%. Growth is supported by increasing reliance on 100% recycled paperboard, demand from industrial applications, and the surge in e-commerce packaging. Paper tubes and cores are essential in industries ranging from textiles and films to construction and packaging, where durability, sustainability, and cost-effectiveness are critical factors.
The market is dominated by spiral-wound technology, which delivers efficiency and versatility in manufacturing cores for paper, textile winding, plastic films, and more. Heavy-duty, high-strength cores are particularly valued in manufacturing environments where dimensional stability and compressive strength are non-negotiable. At the same time, e-commerce growth is reshaping demand for durable shipping tubes used to protect posters, documents, and fragile items in transit. This positions the market at the intersection of industrial resilience and consumer sustainability preferences.
Key Insights for Industry Professionals:
- 100% recycled paperboard is now a primary raw material, supporting circular economy goals.
- Spiral-wound cores dominate, providing versatility across multiple industries.
- High-strength cores are critical for industrial applications such as paper converting and film winding.
- E-commerce expansion is driving lightweight, durable tube demand for shipping and protective packaging.
Market Analysis: Consolidation, Capacity Expansions, and Innovation in Raw Materials
The paper tubes and cores market is undergoing transformation driven by strategic mergers, capacity expansions, and material innovations. In August 2025, Greif introduced its ModCan™ line, designed to maximize space efficiency and reduce costs, while advancing sustainable practices. In July 2025, Smurfit Westrock announced operational improvements in North America, boosting its ability to supply recycled paperboard critical for paper core manufacturing.
The demand for advanced raw materials is also influencing developments. In June 2025, the TOPPAN Group launched a new BOPP barrier film, which requires high-performance paper cores for winding, underscoring the interdependence between film innovations and core demand. Similarly, May 2025 marked Packaging Corporation of America’s acquisition of Greif’s containerboard business for USD 1.8 billion, consolidating the supply chain and strengthening raw material availability for the sector.
Meanwhile, companies are investing in next-generation production capacity. Yazoo Mills announced a USD 4 million investment in July 2024 for high-speed converting lines and proprietary scheduling software, ensuring efficiency in meeting growing demand. Corex Group (June 2024) secured global certification for its 100% recycled fibers, reinforcing the industry’s commitment to sustainability. In Latin America, Klabin launched the Wicket Paper Bag in January 2025, boosting demand for flexible packaging cores. Finally, Sonoco’s acquisition of Alucan in November 2024 reflects a portfolio strategy balancing aluminum packaging with industrial paper solutions.
Trends and Opportunities Shaping the Future of the Paper Tubes and Cores Market
Strategic Shift Towards High-Performance, Engineered Cores for Advanced Materials
The paper tubes and cores market is witnessing a decisive shift toward high-performance, engineered products tailored for industries handling thinner, stronger, and more valuable materials. Flexible electronics, thin-gauge packaging films, and advanced textiles require cores with superior dimensional tolerance, structural integrity, and smooth surfaces to avoid costly production interruptions. Precision-engineered cores prevent creases, wrinkles, and deformation by maintaining uniform tension throughout winding and unwinding, ensuring product protection across the supply chain. A case study in industrial applications shows how advanced core designs significantly reduce material waste and line downtime, making them indispensable in sectors like paper, packaging, and textiles. The rise of flexible electronics covering applications from foldable displays to stretchable sensors is creating a high-growth segment where lightweight yet robust cores minimize shipping costs while protecting fragile, high-value substrates. This evolution highlights the growing role of engineered cores as enablers of efficiency and quality in increasingly complex manufacturing ecosystems.
Adoption of Advanced Adhesives and Barrier Coatings to Enhance Functionality
Another defining trend in the paper tubes and cores market is the integration of advanced adhesives and barrier coatings to meet the stringent demands of industries such as food, pharmaceuticals, and chemicals. Manufacturers are moving away from conventional plastic laminations toward water-based coatings that provide moisture, oil, and heat resistance while remaining fully recyclable within paper streams. For example, functional coating providers now offer solutions that deliver superior repulpability, aligning with circular economy goals. Research initiatives are exploring biopolymer and shellac-based nanocomposite coatings to enhance grease and moisture resistance, opening new pathways for food-grade applications. Moreover, plasma-treated Kraft paper with super-hydrophobic surfaces demonstrates the potential to protect sensitive materials like textiles or films during storage and transport. These innovations not only preserve the integrity of high-value contents but also help brands meet tightening sustainability regulations by reducing reliance on plastics and enhancing recyclability across packaging formats.
Development of Circular and Recyclable Composite Can Structures for Packaging
The shift toward sustainable packaging is unlocking a significant growth opportunity in recyclable composite can structures. With rising pressure from global regulations, such as the European Union’s packaging directives, and increasing consumer demand for plastic-free solutions, brands are looking to replace conventional plastic containers with fully recyclable, paper-based alternatives. A major challenge lies in eliminating non-recyclable elements such as plastic liners and metal end caps, which contaminate recycling streams. To address this, innovators are developing mono-material solutions that incorporate paper-based membranes and recyclable end caps, creating composite cans that can seamlessly enter paper recycling systems. These advancements are driving adoption in categories like coffee, tea, spices, and snack foods, where consumers increasingly favor eco-friendly packaging. For manufacturers, the transition to recyclable composite cans represents not just compliance with regulations but also a competitive edge, as sustainability credentials are now a key differentiator in winning consumer loyalty and securing contracts with environmentally conscious brands.
Integration of Digital Printing and Smart Technologies for Supply Chain Efficiency
Paper tubes and cores are evolving from purely functional products into smart, connected assets that enhance supply chain visibility and brand engagement. Digital printing allows manufacturers to deliver mass customization at scale, enabling brands to launch limited-edition designs or personalized marketing campaigns without incurring the setup costs of traditional printing methods. Beyond aesthetics, the integration of QR codes and RFID tags directly into the structure of tubes and cores supports real-time inventory tracking and authentication. A report on supply chain efficiency suggests that such technologies can improve inventory management by up to 30%, reducing risks of overstocking or shortages. For consumers, these smart features provide transparency, allowing access to product origin, usage, and recycling data through a simple scan. By combining functional efficiency with marketing and traceability, smart paper cores transform into value-added components that support operational excellence while reinforcing sustainability narratives across industries.
Competitive Landscape: Global Leaders in Paper Tubes and Cores Industry
The competitive environment is shaped by global packaging majors and specialized manufacturers leveraging vertical integration, recycled material innovation, and capacity expansion to strengthen their market positions.
Sonoco Products Company: Vertical Integration Driving Core Manufacturing
Sonoco is a global leader in industrial packaging, producing HQ® brand paper tubes and cores for paper mills, textiles, and construction. Its strength lies in vertical integration, owning recycled paperboard mills to secure raw material supply. Its offerings include newsprint cores with metal ends and sheeter cores for cut-size operations. In November 2024, Sonoco expanded into aluminum packaging via its Alucan acquisition, while maintaining a strong focus on industrial paper products.
Smurfit Kappa Group plc: Sustainable Coreboard Leadership
Smurfit Kappa is a global giant in paper-based packaging and produces high-quality 100% recycled coreboard. Its strategy revolves around a circular business model and continuous mill investments. In 2025, Smurfit Westrock announced plans to eliminate 600,000 tons of non-strategic capacity, sharpening efficiency. With vertical integration from forests to finished cores, the company ensures consistent supply and quality for diverse industries.
Greif, Inc.: Innovation with ModCan™ Line
Greif is a global packaging leader, offering fiber drums, bulk containers, and paper tubes and cores. In August 2025, it launched the ModCan™ line, designed for space optimization and cost efficiency. Its global manufacturing network and sustainability-driven use of recycled materials strengthen its position. Greif’s strategy centers on operational excellence and broad product offerings, ensuring flexibility for industrial clients.
Caraustar Group (A Greif Company): Specialized in 100% Recycled Cores
As part of Greif, Caraustar is one of North America’s largest paper tube and core producers, widely used in textiles, packaging films, and construction. Its strength lies in being a major consumer of 100% recycled paperboard. The company is recognized for Sonotube® concrete forms, as well as custom-labeled and printed cores. Its strategic direction is focused on cost-effective, sustainable, high-quality products tailored to customer needs.
Corex Group (A VPK Group Company): Tailor-Made Solutions with Recycled Fiber Leadership
Corex, the cores and tubes division of VPK Group, specializes in spiral and parallel-wound cores for tapes, textiles, and industrial paper. With 29 sites in 15 countries, Corex has a strong global footprint. It is vertically integrated, producing its own coreboard from 100% recycled fibers, and offers products with strength ranges from 200 to 1000 joules. In June 2024, it achieved global certification for recycled fibers, reinforcing its leadership in sustainable innovation.
Paper Tubes and Cores Market Share Insights
Paper Cores Anchor Paper Tubes and Cores Market Share by Product Type
Paper cores hold 45% of the paper tubes and cores market in 2025, establishing themselves as the industrial backbone of this industry. Their essential role as mandrels for winding paper, films, foils, and textiles ensures non-discretionary, high-volume demand across converting and manufacturing sectors. Paper tubes follow closely, driven by their widespread use in protective packaging for shipping blueprints, posters, and rolled goods, with additional traction from e-commerce and sustainability trends replacing plastic alternatives. Composite cans occupy a smaller but higher-value share, particularly in consumer-facing applications like snack foods, frozen juice concentrates, and cosmetics, where strong barrier properties and sustainability credentials enhance consumer appeal. Other niche products such as aerospace-grade precision cores or hybrid tubes demonstrate the market’s ability to adapt to specialized, engineered applications. The dominance of paper cores reflects the sector’s industrial roots, while growth in composite cans signals a shift toward premium and consumer-oriented opportunities.
Flexible Packaging Drives Paper Tubes and Cores Market Share by Application
Flexible packaging applications account for 25% of the paper tubes and cores market, making them the single largest end-use segment by 2025. The global surge in packaged foods, pouches, and lightweight wrappers has created constant demand for high-precision paper cores to support film and laminate converting. Adhesive tapes represent the second-largest application, consuming enormous volumes of small-diameter, high-strength cores that underpin packaging, logistics, and industrial operations worldwide. Paper mills and textiles traditional end-users continue to provide stable demand for heavy-duty winding cores used in large parent rolls and yarn production. Construction is emerging as a higher-value segment, where paper tubes are indispensable in forming concrete pillars (sonotubes) and infrastructure applications. Other applications showcase the versatility of paper tubes and cores, from fireworks packaging to specialty films. The dominance of flexible packaging highlights the industry’s integration into high-growth consumer goods supply chains, while adhesive tapes and construction reinforce its indispensable role across industrial and commercial sectors.
United States: Automation and Sustainable Paper Tubes Fuel Market Expansion
The U.S. paper tubes and cores market is witnessing strong growth driven by evolving consumer preferences for sustainable, recyclable, and high-performance packaging, particularly in the e-commerce sector. Companies are increasingly focusing on eco-friendly solutions, such as using recycled paperboard to manufacture durable and versatile paper tubes and cores. Leading manufacturers like Sonoco have heavily invested in recycled material utilization, underscoring the industry’s commitment to sustainability and reduced environmental impact.
Technological advancements are also transforming the market, with investments in high-speed, fully integrated manufacturing systems designed to maximize throughput and ensure consistent quality. Strategic expansions in manufacturing capabilities, including new facilities and upgrades to existing plants, are meeting growing demand across industries such as textiles, films, and paper mills. Additionally, federal and state-level regulations on waste management and recycling are shaping the industry, encouraging products with low VOC content and compliance for direct food contact applications, reinforcing the U.S. market’s focus on safety and sustainability.
Germany: Circular Economy and Eco-friendly Paper Cores Lead Market Innovation
Germany’s paper tubes and cores industry is strongly influenced by its stringent regulatory environment, including the EU Packaging and Packaging Waste Regulation (PPWR) 2025, which promotes eco-friendly and highly recyclable packaging solutions. The country is a leader in the circular economy, with manufacturers collaborating closely with end-users to develop products designed for recyclability and incorporating high percentages of recycled content to meet national and EU sustainability targets.
Technological innovation is a key driver, with German companies offering paper cores with enhanced compression strength and moisture resistance for specialized applications in paper and textile industries. These innovations support high-performance applications while aligning with regulatory compliance and sustainability goals, making Germany a hub for environmentally responsible and technologically advanced paper tube production in Europe.
China: Industrial Growth and E-commerce Demand Boost Paper Tubes Market
China’s paper tubes and cores market is expanding rapidly due to the country’s industrial prowess and massive manufacturing activities, particularly in the textile and paper sectors. The booming e-commerce industry further fuels demand for durable, high-performance packaging solutions, including robust paper tubes and cores capable of supporting high-speed automated packaging lines and ensuring tamper-proof shipping.
Sustainability initiatives under the Chinese government’s dual carbon goals are driving green transformations in the paper and packaging industry, emphasizing eco-friendly, reusable, and reduced-impact products. Technological advancements, such as automation, AI integration, and “5G plus industrial internet” applications, are optimizing production processes, enhancing efficiency, and providing flexible manufacturing capabilities to meet the dynamic needs of both domestic and export markets.
India: Sustainability and Textile Growth Propel Paper Tubes Market
India’s paper tubes and cores market is benefiting from governmental initiatives promoting sustainable packaging and the phased reduction of single-use plastics under the Plastic Waste Management (Amendment) Rules. These policies have accelerated the demand for eco-friendly and reusable paper cores, particularly in sectors such as textiles and paper mills.
The rapid expansion of textile and paper mill industries is a key growth driver, with high-quality cores essential for winding yarn, fabrics, and paper rolls. Sustainability-focused investments exceeding INR 10,000 crore since 2022 have upgraded critical production infrastructure, including wash lines, extruders, and de-contamination units, enhancing recycling capacity. Regulatory advocacy by the Indian Paper Manufacturers Association (IPMA) to protect domestic manufacturers from cheap paper imports also represents a significant market development, shaping the future competitiveness and sustainability of the Indian paper tubes and cores sector.
Paper Tubes and Cores Market Report Scope
Paper Tubes and Cores Market
|
Parameter
|
Details
|
|
Market Size (2025)
|
$5.8 Billion
|
|
Market Size (2034)
|
$10.9 Billion
|
|
Market Growth Rate
|
7.3%
|
|
Segments
|
By Product Type (Paper Tubes, Paper Cores, Composite Cans, Other Products), By Material Type (Kraft Paper, Recycled Paperboard, Other Materials), By Application (Paper Mills, Textile Industry, Flexible Packaging, Adhesive Tapes, Construction, Other Applications)
|
|
Study Period
|
2019- 2024 and 2025-2034
|
|
Units
|
Revenue (USD)
|
|
Qualitative Analysis
|
Porter’s Five Forces, SWOT Profile, Market Share, Scenario Forecasts, Market Ecosystem, Company Ranking, Market Dynamics, Industry Benchmarking
|
|
Companies
|
Sonoco Products Company, Smurfit Kappa Group, International Paper, Mondi Group, Graphic Packaging Holding Company, Corenso, Sino-Forest Corporation, Nippon Paper Industries Co., Ltd., Rondo-Pak, LLC, Western Container Corporation, Valk Industries, Inc., HBD Packaging, Visy, Recycled Paperboard Technical Association (RPTA), A.H. International
|
|
Countries
|
US, Canada, Mexico, Germany, France, Spain, Italy, UK, Russia, China, India, Japan, South Korea, Australia, South East Asia, Brazil, Argentina, Middle East, Africa
|
Paper Tubes and Cores Market Segmentation
By Product Type
- Paper Tubes
- Paper Cores
- Composite Cans
- Other Products
By Material Type
- Kraft Paper
- Recycled Paperboard
- Other Materials
By Application
- Paper Mills
- Textile Industry
- Flexible Packaging
- Adhesive Tapes
- Construction
- Other Applications
Countries Analyzed
- North America (US, Canada, Mexico)
- Europe (Germany, UK, France, Spain, Italy, Russia, Rest of Europe)
- Asia Pacific (China, India, Japan, South Korea, Australia, South East Asia, Rest of Asia)
- South America (Brazil, Argentina, Rest of South America)
- Middle East and Africa (Saudi Arabia, UAE, Rest of Middle East, South Africa, Egypt, Rest of Africa)
Top Companies in Paper Tubes and Cores Market
- Sonoco Products Company
- Smurfit Kappa Group
- International Paper
- Mondi Group
- Graphic Packaging Holding Company
- Corenso
- Sino-Forest Corporation
- Nippon Paper Industries Co., Ltd.
- Rondo-Pak, LLC
- Western Container Corporation
- Valk Industries, Inc.
- HBD Packaging
- Visy
- Recycled Paperboard Technical Association (RPTA)
- A.H. International
*List not Exhaustive
Research Coverage
This report by USDAnalytics investigates the global paper tubes and cores market, examining breakthroughs in high-strength engineered cores, recycled paperboard utilization, and innovative barrier coatings. The analysis reviews evolving industrial demands across textiles, films, paper mills, construction, and e-commerce packaging, highlighting strategic expansions, mergers, and technological advancements that shape competitive dynamics. It highlights opportunities arising from sustainability-driven circular economy initiatives, digital printing integration, and smart tube technologies, which enhance operational efficiency and supply chain visibility. This report is an essential resource for manufacturers, investors, and industry professionals seeking actionable insights into product types, material innovations, regional trends, and the competitive landscape. By combining historical data from 2021–2024 with forecasts through 2034, and analyzing 15+ leading companies, the report offers a comprehensive overview of market drivers, growth opportunities, and sectoral evolution across diverse applications and materials.
Scope Highlights:
- Segmentation: By Product Type (Paper Tubes, Paper Cores, Composite Cans, Other Products), By Material Type (Kraft Paper, Recycled Paperboard, Other Materials), By Application (Paper Mills, Textile Industry, Flexible Packaging, Adhesive Tapes, Construction, Other Applications)
- Geographic Scope: Analysis spans 25+ countries across North America, Europe, Asia Pacific, Latin America, the Middle East & Africa
- Timeframe: Historic data from 2021 to 2024 and forecast data from 2025 to 2034
- Companies: Analysis and profiles of 15+ leading companies including Sonoco Products Company, Smurfit Kappa Group, International Paper, Mondi Group, and Graphic Packaging
Methodology
USDAnalytics employed a robust research methodology combining primary interviews with manufacturers, distributors, and end-users, along with secondary research from regulatory reports, industry publications, and corporate disclosures, to provide a detailed assessment of the paper tubes and cores market. Market sizing and forecasting were developed using historical production and consumption data, supply chain analysis, and projected demand across key industries such as textiles, flexible packaging, paper mills, and construction. Qualitative evaluation focused on material innovation, advanced adhesives, barrier coatings, and smart tube technologies, while quantitative analysis covered production capacities, market share, and financial performance of top players. Regional insights were integrated with trend analysis to identify growth opportunities, technological adoption, and sustainability-driven initiatives, ensuring actionable intelligence for industry professionals navigating a rapidly evolving, eco-conscious market.
Deliverables:
- Comprehensive Market Research Report (PDF and Excel) with detailed tables, charts, and interactive visualizations.
- Country-Specific Forecasts & Analysis.
- Segment-Wise Revenue Forecasts (2025–2034).
- Competitive Analysis, Benchmarking, and SWOT Profiles.
- Recent Developments & Innovation Tracker.
- Executive Summary & Analyst Commentary.
- Post-Purchase Analyst Support for Client-Specific Questions and Custom Data Requirements.
