Market Overview: Type I Glass and Biologics Drive High-Value Growth
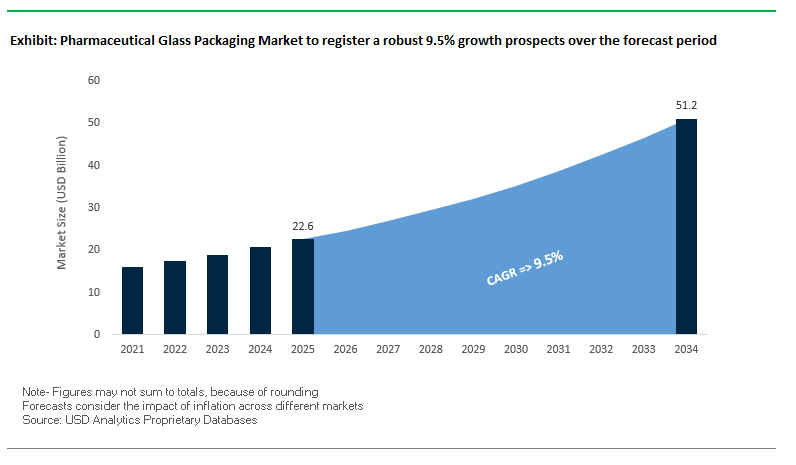
The global pharmaceutical glass packaging market is projected to expand from USD 22.6 billion in 2025 to USD 51.1 billion by 2034, growing at a robust CAGR of 9.5%. This growth is underpinned by the surging demand for safe, inert, and high-performance packaging solutions for injectable drugs, vaccines, and biologics. For industry professionals, the market’s rapid evolution poses strategic questions around supply chain security, biologics growth, and innovations in ready-to-use (RTU) formats that enhance manufacturing efficiency and patient safety.
The dominance of Type I borosilicate glass underscores its critical role in preserving the integrity of sensitive formulations. Vials remain the leading product type due to their widespread use in liquid injectables, while pre-filled syringes are emerging as a fast-growing segment, particularly in chronic disease management where convenience and accuracy are paramount. The rise of biologics and specialty drugs continues to fuel the demand for premium glass containers that minimize drug–container interactions. Simultaneously, manufacturers are investing in patient-centric packaging with features that reduce errors and support adherence.
Key Insights for Industry Professionals:
- Type I borosilicate glass dominates due to unmatched chemical resistance and thermal stability.
- Vials remain the primary format, reinforced by RTU innovations for faster filling and reduced contamination risks.
- Biologics and specialty drugs are the key demand drivers, requiring premium-quality packaging.
- Pre-filled syringes are the fastest-growing format, enabling accurate self-administration and reduced medical errors.
Market Analysis: Strategic Investments and Portfolio Shifts in 2024–2025
The pharmaceutical glass packaging industry is undergoing structural changes, with leading players streamlining portfolios, expanding production, and investing in advanced solutions. In August 2025, Gerresheimer announced plans to separate its molded glass business, sharpening its focus on high-value pharma and biotech packaging systems. Around the same time, Constantia Flexibles committed over €100 million toward expanding its pharmaceutical packaging portfolio, a move aimed at strengthening its barrier protection offerings.
Parallel developments across the broader packaging sector also shape the ecosystem. In July 2025, Ardagh Glass Packaging-Europe (AGP-Europe) introduced a lightweight glass wine bottle, indirectly boosting demand for compatible closures and manufacturing synergies within the glass supply chain. Additionally, AptarGroup’s July 2025 launch of its TSP all-plastic spray pump highlights the growing competition between traditional glass formats and sustainable plastic alternatives, especially in adjacent healthcare markets.
Earlier in October 2024, Bayer introduced PET blister packaging for its Aleve brand, eliminating PVC in line with sustainability goals an innovation that puts pressure on glass suppliers to continue evolving eco-conscious solutions. Likewise, Sonoco’s acquisition of Alucan in November 2024 strengthened aluminum packaging synergies, further intensifying the competitive dynamics between glass, plastic, and metal-based pharmaceutical packaging.
Transformative Trends and Opportunities in the Pharmaceutical Glass Packaging Market
Accelerated Adoption of Borosilicate Glass for High-Value Biologics
The pharmaceutical glass packaging market is experiencing a pronounced material shift toward Type I borosilicate glass, primarily driven by the rise of biologics and injectable therapies. Unlike soda-lime glass, borosilicate offers superior chemical durability and a low coefficient of thermal expansion, making it resistant to thermal shock and ion leaching. This inertness is critical for biologics such as monoclonal antibodies and vaccines, which are highly sensitive to degradation from oxygen, moisture, and UV light. Regulatory frameworks reinforce this transition: both the U.S. Pharmacopeia (USP) and European Pharmacopoeia classify borosilicate as the gold standard for injectable drugs, while FDA and EMA guidelines on container closure systems emphasize minimizing risks of leachables, delamination, and particulate matter. For pharmaceutical manufacturers, the shift to borosilicate is not optional but a requirement for ensuring drug stability, patient safety, and compliance with global regulatory standards. As biologics continue to dominate new drug pipelines, demand for borosilicate vials, syringes, and cartridges is set to rise significantly.
Strategic Investments in Coated Glass to Mitigate Delamination and Interaction Risks
Beyond the material-level transition, pharmaceutical glass packaging is undergoing an era of innovation focused on coating technologies and engineered glass compositions to address persistent risks of delamination and ion exchange. Delamination, particularly in the heel zone of vials, poses a serious safety risk by generating glass flakes in drug formulations. To counter this, companies like Schott Pharma have launched vials with homogenized inner surfaces to prevent micro-cracking and surface degradation. Corning’s Valor® Glass represents a landmark innovation, eliminating boron oxide from its structure to mitigate delamination risks and delivering 30% greater resistance to breakage compared to traditional borosilicate. Coating technologies are also advancing rapidly, modifying glass surfaces to enhance chemical stability, reduce leachables, and extend drug compatibility. These innovations not only improve safety and efficacy but also streamline manufacturing by reducing line stoppages from vial breakage or particulate contamination, thus strengthening the overall efficiency of pharmaceutical supply chains.
Development and Standardization of PCR Borosilicate Glass for Circular Economy Compliance
A major growth opportunity lies in aligning pharmaceutical glass packaging with global sustainability goals by creating scalable supply chains for post-consumer recycled (PCR) borosilicate glass. With the WHO and corporate ESG commitments pushing healthcare toward circular economy models, demand is rising for recycled glass that meets the stringent USP and EMA standards for drug safety. Developing high-quality PCR borosilicate requires investments in advanced collection, refining, and contamination-removal technologies to achieve pharmaceutical-grade purity. While technically complex, success in this area would enable manufacturers to meet carbon reduction targets, reduce reliance on virgin raw materials, and secure new high-margin revenue streams. Closed-loop systems where used vials and ampoules are collected, recycled, and reintroduced into the packaging supply chain would also provide a sustainability advantage for companies seeking to differentiate in competitive pharmaceutical markets increasingly shaped by environmental performance metrics.
Integrated Packaging Solutions with IoT and Track-and-Trace Serialization
The pharmaceutical glass packaging market is also expanding beyond containment into digital and connected solutions. Serialization, mandated under the EU’s Falsified Medicines Directive (FMD) and the U.S. DSCSA, is driving the adoption of 2D DataMatrix codes and embedded identifiers directly on vials, syringes, and ampoules. This enhances anti-counterfeiting efforts and ensures full traceability across the supply chain. Beyond compliance, integration of IoT-enabled sensors and RFID tags is providing pharmaceutical distributors with real-time visibility into storage and transit conditions, particularly for temperature-sensitive biologics and vaccines. A recent case study demonstrated how IoT monitoring helped a global vaccine distributor prevent spoilage, saving millions in losses. At the patient level, smart glass packaging with QR and NFC capabilities enables direct engagement by providing dosage reminders, product authentication, and access to digital health platforms. These innovations position pharmaceutical glass not just as a protective material but as an intelligent interface between manufacturers, regulators, and patients.
Competitive Landscape: Global Leaders in Pharmaceutical Glass Packaging
The pharmaceutical glass packaging industry is dominated by specialist manufacturers and integrated solution providers who leverage advanced glass science, patient-centric designs, and global footprints.
SCHOTT AG: Pioneering Borosilicate Glass and RTU Formats
SCHOTT, through its SCHOTT Pharma division, leads in Type I borosilicate glass tubing and packaging. Its portfolio spans vials, syringes, ampoules, and cartridges, built on its proprietary FIOLAX® tubing. SCHOTT has been at the forefront of RTU innovations, with products such as adaptiQ® sterile vials and everic® vials, designed for high-speed filling lines and biologics protection. Its vertically integrated model ensures end-to-end quality control, while its sustainability strategy drives investments in greener production methods.
Gerresheimer AG: Strategic Refocus on High-Value Pharma Solutions
Gerresheimer offers a broad range of tubular and molded glass packaging, alongside plastic containers and drug delivery systems. Following its 2024 acquisition of Bormioli Pharma, the company announced in August 2025 that it would divest its molded glass business to prioritize advanced containment and delivery systems. With significant investments in syringe capacity expansion and modernization, Gerresheimer is positioning itself as a leading supplier of glass injection vials, RTU cartridges, and syringes tailored for biotech and pharma industries.
Corning Incorporated: Valor® Glass Revolutionizing Safety and Durability
Corning has redefined pharmaceutical glass with its Valor® Glass, engineered to be 30 times stronger than conventional glass and capable of reducing particulate contamination by up to 96%. These properties make Valor® Glass highly attractive for biologics and high-value injectables. Its collaborations with Stevanato Group and inclusion in West Pharmaceutical Services’ Ready Pack™ portfolio reflect its role as a technology enabler in complete containment solutions. Corning’s strategy is firmly anchored in enhancing patient safety, improving line efficiency, and lowering overall supply chain risks.
Stevanato Group S.p.A.: Integrated Glass and Drug Delivery Platforms
Stevanato Group is a leader in integrated containment and delivery systems, producing vials, syringes, and cartridges, complemented by device assembly and inspection systems. Its EZ-fill® platform, offering pre-sterilized RTU vials and syringes, is widely adopted for reducing contamination risks and accelerating pharma filling processes. The company continues to expand capacity through acquisitions such as SVM and Medical Glass, while its contract manufacturing services provide additional value. Its one-stop-shop model strengthens its competitive positioning globally.
Nipro Corporation: Premium Pre-Fillable Syringes and Vials
Nipro specializes in glass packaging and medical devices, with a strong portfolio of pre-fillable syringes, cartridges, and vials. Its VIALEX™ technology enhances surface durability, removing the need for ammonium sulfate treatment and improving container performance for injectable drugs. With its state-of-the-art manufacturing facilities, Nipro ensures compliance with international standards, serving global pharma leaders. Its strategic focus is on offering complete containment systems, including rubber stoppers and accessories, ensuring compatibility and safety for a wide range of therapeutics.
Pharmaceutical Glass Packaging Market Share Insights
Vials Lead Pharmaceutical Glass Packaging Market Share by Product Type
Vials command the largest share of the pharmaceutical glass packaging market by product type, holding 35% in 2025, and their dominance is rooted in their critical role in the storage of biologics, vaccines, and injectable drugs. Their superior sterility, barrier properties, and compatibility with lyophilized and liquid formulations make them indispensable in an era defined by biologic therapies and HPAPIs (high-potency active pharmaceutical ingredients). Cartridges and syringes, while holding a smaller share, represent the fastest-growing category as chronic disease management shifts towards self-administration, with glass playing an essential role in auto-injectors and pen-injectors. Ampoules, though traditional, remain vital for oxygen-sensitive and single-dose medications, while glass bottles sustain relevance in syrups and oral solutions where plastic is less suitable due to chemical interaction or premium branding needs. Across all product types, the decisive shift from Type III soda-lime glass to Type I borosilicate glass is a cross-cutting driver, ensuring chemical resistance, thermal stability, and patient safety.
Parenteral Applications Dominate Pharmaceutical Glass Packaging Market Share
Parenteral drugs represent 72% of the pharmaceutical glass packaging market by application in 2025, making this segment the undisputed core driver of demand. Glass is the only material capable of meeting the stringent requirements for injectables, offering chemical inertness, sterility, and resistance to autoclaving. The explosive growth of biologics, vaccines, and oncology injectables ensures that demand for high-quality borosilicate glass continues to climb. Oral formulations maintain a smaller but important 18% share, largely for light-sensitive and liquid products where amber glass or inert packaging is necessary to avoid contamination. Ophthalmic and nasal applications, though niche, highlight the adaptability of glass packaging in highly specialized delivery systems requiring clarity, precision, and sterility. The overarching insight is that injectables, supported by aging populations and the global biologics boom, will remain the anchor for glass packaging demand, ensuring sustained investment in high-performance borosilicate formats.
United States: Rising Demand for Smart and Sustainable Pharmaceutical Glass Packaging
The U.S. pharmaceutical glass packaging market is being driven by evolving consumer preferences for health-focused, convenient, and tamper-evident packaging. Increasing demand for over-the-counter (OTC) medications and nutraceuticals is fueling the adoption of secure packaging solutions that ensure product integrity and patient safety. Technological advancements are reshaping the sector, with companies integrating sensors, RFID tags, and printed electronics to enable real-time monitoring of medication adherence and provide actionable data to healthcare providers.
Sustainability is a growing priority, as seen with Tekni-Plex introducing recyclable polyester-based films and lidding systems for blister packaging. Leading companies like Amcor are expanding operations, including a new facility in Ohio for aluminum closures supporting sustainable pharmaceutical and beverage packaging. The highly regulated environment, enforced by the U.S. Food and Drug Administration (FDA), ensures strict compliance for child-resistant features, material compatibility, and tamper-evident seals, which continues to drive the use of glass packaging in the U.S. pharmaceutical industry.
Germany: Circular Economy Leadership and Technologically Advanced Glass Packaging
Germany’s pharmaceutical glass packaging market operates under a stringent regulatory framework, including the EU Packaging and Packaging Waste Regulation (PPWR) 2025, which promotes eco-friendly and highly recyclable packaging. The market emphasizes circular economy principles, encouraging the use of recycled content and packaging designed for recyclability to meet both national and EU targets.
Technological innovation is critical, with companies like Uhlmann Packaging Group pioneering digitally advanced and flexible blister packaging lines that integrate seamlessly into pharmaceutical production settings. Governmental mandates under the new PPWR include waste reduction targets and recyclability requirements, creating strong incentives for companies to adopt sustainable glass packaging solutions. Germany’s leadership in recyclable and innovative pharmaceutical packaging positions it as a global benchmark for the sector.
China: Healthy China 2030 Plan and Technological Integration Driving Glass Packaging Demand
China’s pharmaceutical glass packaging market is being shaped by the government’s Healthy China 2030 initiative, aimed at expanding healthcare access and improving public health over the next 15 years. This program is driving investments across the healthcare sector, thereby increasing demand for high-quality and secure glass packaging.
Technological advancements, including automation, AI, and the integration of “5G plus industrial internet”, are enhancing production efficiency and enabling flexible manufacturing processes. Rapid growth in e-commerce is also boosting the market, increasing demand for tamper-evident, durable, and protective packaging for pharmaceuticals and medical devices. Rising disposable incomes and large population bases further strengthen China’s pharmaceutical glass packaging industry.
India: Government Schemes and Pharmaceutical Sector Expansion Fuel Glass Packaging Growth
India’s pharmaceutical glass packaging market is benefitting from initiatives like the Ayushman Bharat scheme, which expands health insurance coverage and supports the growth of the pharmaceutical industry. India ranks as the third-largest pharmaceutical market globally by volume, driving increased use of glass packaging for oral dosages.
Sustainability is gaining traction, supported by GST reforms that reduce tax on paper pulp molded trays, promoting eco-friendly practices. Companies are investing in advanced machinery and alternative raw materials, such as rice husk and bagasse, to enhance efficiency and product quality. Strategic partnerships between Indian firms and multinational corporations help expand access to regulated and emerging markets while mitigating clinical trial risks. These developments position India as a fast-growing hub for sustainable and high-quality pharmaceutical glass packaging.
Brazil: Regulatory Support and Innovative Technologies Strengthen Glass Packaging Market
Brazil’s pharmaceutical glass packaging market is influenced by legislation such as the National Solid Waste Policy, which encourages a shift toward reusable, durable, and sustainable alternatives. The market is increasingly adopting robotics and artificial intelligence (AI) to improve operational efficiency, quality control, and production accuracy.
Sustainability initiatives are supported by WWF-Brazil studies highlighting the benefits of replacing disposable plastics with glass packaging, reducing environmental pollution while promoting economic growth. Strategic investments, such as Canpack Group’s new facility in Minas Gerais, are expected to begin operations by 2024, ensuring a reliable supply of innovative and eco-friendly glass packaging solutions for the pharmaceutical sector.
Japan: Advanced Recycling, Bio-based Materials, and High-Performance Glass Packaging
Japan’s pharmaceutical glass packaging market is characterized by advanced recycling systems, supported by the Containers and Packaging Recycling Law, which ensures efficient collection and repurposing of waste materials. The industry is also embracing bio-based materials, with companies like Spiber developing Brewed Protein™ for sustainable packaging applications.
Innovation is key, with the market focusing on high-performance packaging that offers dimensional stability, resistance to deformation, and functionality for electronics and high-value medical products. Continuous advancements in sustainability, recycling, and functionality position Japan as a global leader in eco-friendly and technologically advanced pharmaceutical glass packaging solutions.
Pharmaceutical Glass Packaging Market Report Scope
Pharmaceutical Glass Packaging Market
|
Parameter
|
Details
|
|
Market Size (2025)
|
$22.6 Billion
|
|
Market Size (2034)
|
$51.1 Billion
|
|
Market Growth Rate
|
9.5%
|
|
Segments
|
By Product Type (Vials, Bottles, Ampoules, Cartridges & Syringes), By Glass Type (Type I, Type II, Type III), By Application (Parenteral, Oral, Nasal, Ophthalmic), By End-Use Industry (Pharmaceutical Companies, Biopharmaceutical Companies, CDMOs, Research & Development)
|
|
Study Period
|
2019- 2024 and 2025-2034
|
|
Units
|
Revenue (USD)
|
|
Qualitative Analysis
|
Porter’s Five Forces, SWOT Profile, Market Share, Scenario Forecasts, Market Ecosystem, Company Ranking, Market Dynamics, Industry Benchmarking
|
|
Companies
|
Gerresheimer AG, SCHOTT AG, SGD Pharma, Stevanato Group, Nipro Corporation, Bormioli Pharma S.p.A., Corning Incorporated, Piramal Glass Private Limited, AptarGroup, Inc., West Pharmaceutical Services, Inc., Ardagh Group, Hindustan National Glass & Industries Ltd., Allied Glass Containers, Stolzle Glass Group, Beatson Clark Ltd.
|
|
Countries
|
US, Canada, Mexico, Germany, France, Spain, Italy, UK, Russia, China, India, Japan, South Korea, Australia, South East Asia, Brazil, Argentina, Middle East, Africa
|
Pharmaceutical Glass Packaging Market Segmentation
By Product Type
- Vials
- Bottles
- Ampoules
- Cartridges & Syringes
By Glass Type
By Application
- Parenteral
- Oral
- Nasal
- Ophthalmic
By End-Use Industry
- Pharmaceutical Companies
- Biopharmaceutical Companies
- CDMOs
- Research & Development
Countries Analyzed
- North America (US, Canada, Mexico)
- Europe (Germany, UK, France, Spain, Italy, Russia, Rest of Europe)
- Asia Pacific (China, India, Japan, South Korea, Australia, South East Asia, Rest of Asia)
- South America (Brazil, Argentina, Rest of South America)
- Middle East and Africa (Saudi Arabia, UAE, Rest of Middle East, South Africa, Egypt, Rest of Africa)
Top Companies in Pharmaceutical Glass Packaging Market
- Gerresheimer AG
- SCHOTT AG
- SGD Pharma
- Stevanato Group
- Nipro Corporation
- Bormioli Pharma S.p.A.
- Corning Incorporated
- Piramal Glass Private Limited
- AptarGroup, Inc.
- West Pharmaceutical Services, Inc.
- Ardagh Group
- Hindustan National Glass & Industries Ltd.
- Allied Glass Containers
- Stolzle Glass Group
- Beatson Clark Ltd.
*List not Exhaustive
Research Coverage
This USDAnalytics report investigates the global pharmaceutical glass packaging market, offering an in-depth understanding of growth drivers, material innovations, and emerging product formats shaping the sector. The analysis reviews key breakthroughs in Type I borosilicate glass adoption, pre-filled syringes, and ready-to-use (RTU) solutions that enhance patient safety and streamline pharmaceutical manufacturing. It highlights transformative trends, including coated glass technologies to mitigate delamination, the integration of post-consumer recycled (PCR) glass for circular economy compliance, and the rise of smart, IoT-enabled packaging solutions for serialization and track-and-trace. This report is an essential resource for industry professionals, including pharmaceutical companies, biopharmaceutical innovators, CDMOs, and packaging technology developers, providing actionable insights into strategic investments, regulatory frameworks, and competitive dynamics. Additionally, the study presents detailed company profiles and innovations driving market leadership, enabling informed decisions across product development, sustainability initiatives, and supply chain optimization. By combining historical analysis from 2021–2024 with forward-looking projections to 2034, USDAnalytics delivers a comprehensive roadmap for navigating a rapidly evolving pharmaceutical glass landscape.
Scope Highlights
- Segmentation: By Product Type (Vials, Bottles, Ampoules, Cartridges & Syringes), By Glass Type (Type I, Type II, Type III), By Application (Parenteral, Oral, Nasal, Ophthalmic), By End-Use Industry (Pharmaceutical Companies, Biopharmaceutical Companies, CDMOs, Research & Development)
- Geographic Scope: Analysis spans 25+ countries across North America, Europe, Asia Pacific, Latin America, the Middle East & Africa
- Data Coverage: Historic data from 2021 to 2024 and forecast data from 2025 to 2034
- Companies: Analysis/profiles of 15+ companies including Gerresheimer AG, SCHOTT AG, Stevanato Group, Corning Incorporated, Nipro Corporation, Bormioli Pharma, SGD Pharma, and more
Methodology
This report employs a multi-layered research methodology combining primary and secondary data sources to ensure accuracy and relevance for pharmaceutical glass packaging professionals. Primary research involved structured interviews with executives, R&D managers, and packaging specialists across leading global pharmaceutical companies, biopharmaceutical firms, CDMOs, and packaging manufacturers. Secondary research incorporated extensive review of company filings, regulatory databases, industry journals, patent filings, and conference proceedings, allowing USDAnalytics to triangulate market trends, innovations, and competitive strategies. Quantitative analysis was applied to historic market data from 2021–2024, while advanced forecasting models were used to project trends from 2025 to 2034, accounting for regulatory impacts, technological adoption rates, and sustainability mandates. The methodology emphasizes material-specific demand, product format growth, and region-specific market dynamics, enabling a comprehensive understanding of both global and localized market conditions. Data verification and validation processes were applied at each stage to ensure robustness, supporting actionable insights for investment, strategy development, and market entry planning.
Deliverables:
- Comprehensive Market Research Report (PDF and Excel) with detailed tables, charts, and interactive visualizations.
- Country-Specific Forecasts & Analysis.
- Segment-Wise Revenue Forecasts (2025–2034).
- Competitive Analysis, Benchmarking, and SWOT Profiles.
- Recent Developments & Innovation Tracker.
- Executive Summary & Analyst Commentary.
- Post-Purchase Analyst Support for Client-Specific Questions and Custom Data Requirements.
